


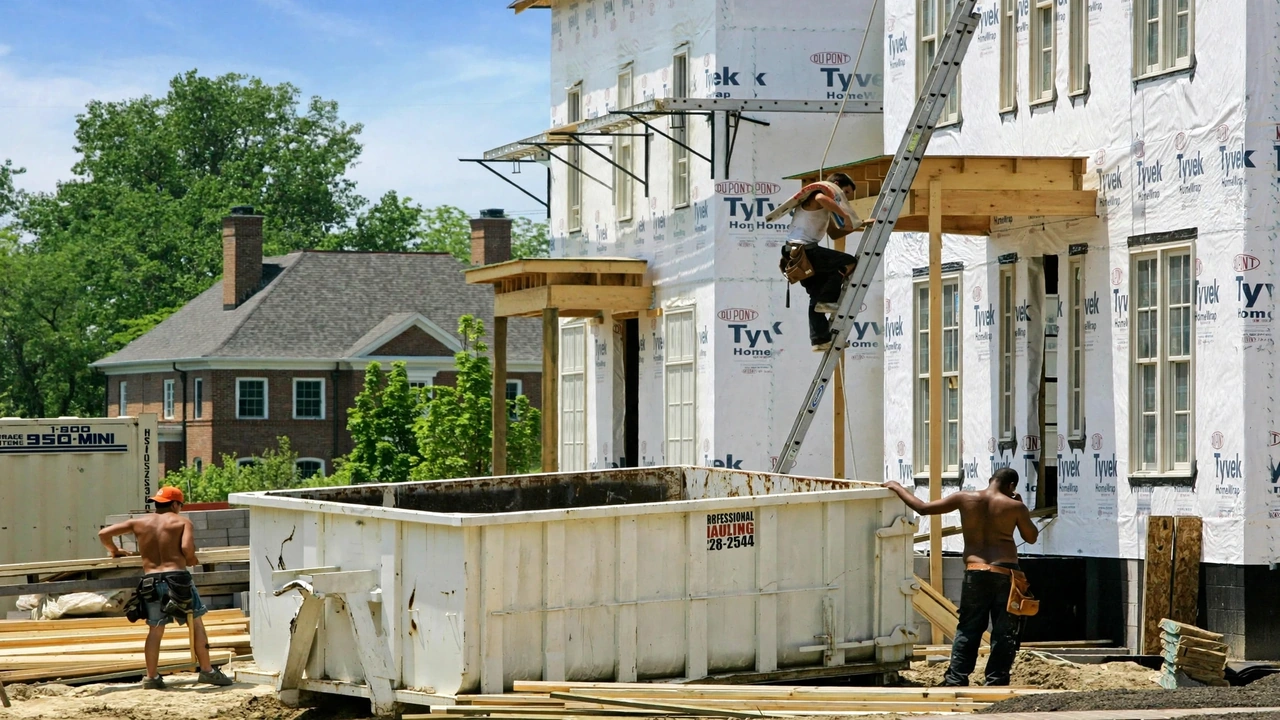
Sales of new single-family houses in the United States fell to a seasonally adjusted annual rate (SAAR) of 607,000, marking a 10.5 percent decline from the previous month and the lowest level since January, according to the latest verified estimates released jointly by the U.S. Census Bureau and the Department of Housing and Urban Development (HUD).
The contraction reflects a housing market increasingly paralyzed as mortgage rates push past 7 percent, freezing out prospective buyers and forcing builders to accumulate inventory.
Sales Volume and Statistical Significance
The 607,000 SAAR represents a drop from the revised June 2026 rate of 678,000, and is 6.3 percent below the July 2025 estimate of 648,000. While the headline 10.5 percent month-over-month decline appears steep, the Census Bureau’s data tables show a 90-percent confidence interval of ±14.0 percent for this change.
Because this range includes zero, the single-month drop is not statistically significant due to the survey’s inherent sampling variability. However, the broader structural shift slowing volume against rising inventory is confirmed by the months’ supply metric.
The decline was not uniform across the country. The Midwest experienced the steepest contraction, with sales plummeting 42.7 percent to an annualized rate of 43,000. The South, the nation’s largest new-home market by volume, fell 13.0 percent to 383,000. Conversely, sales rose 30.3 percent in the Northeast (to 43,000) and 6.2 percent in the West (to 138,000).
Inventory and Months’ Supply: A 15-Year High
As sales volume contracted, the supply of available homes continued to climb. The seasonally adjusted estimate of new houses for sale at the end of the period was 488,000, a 1.9 percent increase from June and 4.3 percent above the year-ago level. This divergence between slowing sales and rising inventory pushed the months’ supply to 9.6 months.
Investozora Calculation: Dividing the 488,000 available homes by the monthly sales pace (607,000 SAAR ÷ 12 = 50,583 homes per month) yields a 9.64-month supply. This confirms the Census Bureau’s reported 9.6 months, representing a 12.9 percent increase from June’s 8.5 months and the highest supply overhang since the aftermath of the 2008 financial crisis.
Pricing Pressures and Builder Reality
Facing higher borrowing costs, builders are increasingly relying on price adjustments and incentives to move completed inventory. The median sales price of new houses sold was $393,800, down 2.3 percent from June and 0.9 percent below the year-ago level. Meanwhile, the average sales price rose 4.1 percent to $508,800.
This divergence indicates a shift in the mix of homes sold, with a higher concentration of transactions occurring in more expensive price brackets even as overall volume declines.
Of the 488,000 homes available for sale, 117,000 were already completed and sitting empty. This completed inventory represents a growing financial burden for builders, who must carry construction loan interest and property taxes while waiting for buyers qualified at current interest rates.
What Happens Next
The housing market remains highly sensitive to the Federal Reserve’s monetary policy path and the trajectory of the 10-year Treasury yield, which directly influences 30-year mortgage rates. If borrowing costs remain anchored near or above 7 percent, the months’ supply metric is likely to face further upward pressure, potentially forcing deeper price concessions from national builders.
The next New Residential Sales report, which will provide the first official Census data covering the August 2026 reference period, is scheduled for release on September 24, 2026, at 10:00 AM EDT.
This article relies on the latest fully verified U.S. Census Bureau and HUD New Residential Sales dataset, covering the July 2026 reference period and released August 25, 2026, which establishes the confirmed baseline for the late-summer market freeze.
