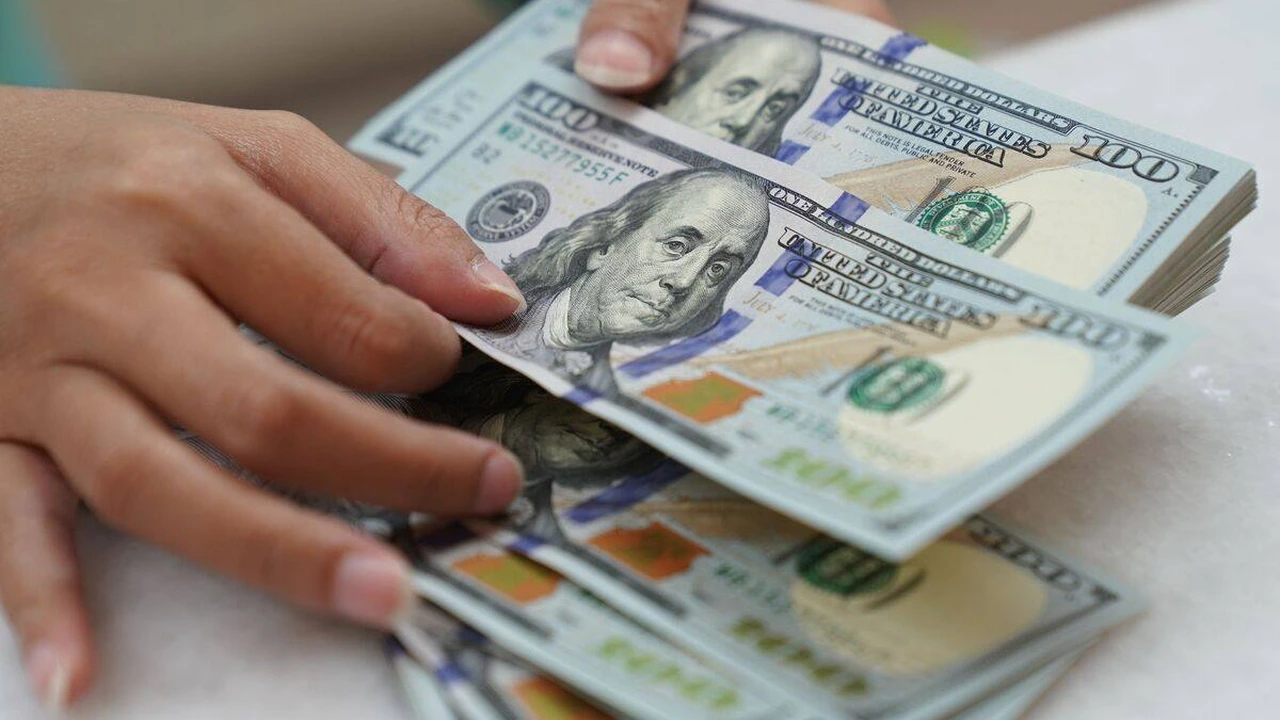
The U.S. dollar strengthened broadly on September 23, with the greenback gaining against all G10 currencies and most major emerging-market currencies as traders weighed relative interest-rate expectations, shifting commodity prices and a heavy run of global economic data.
Marc Chandler’s original September 23 market assessment found the euro approaching $1.14 despite a firmer-than-expected eurozone preliminary PMI, while the dollar moved toward ¥158 against the yen.
Sterling fell through $1.3280, the Canadian dollar weakened beyond C$1.4090 and the Australian dollar slipped to $0.7080. November WTI crude was consolidating below $90 a barrel at the time, while benchmark interest rates were comparatively subdued.
The backdrop changed further after the U.S. September flash PMI was released. S&P Global reported that the U.S. composite index rose to 58.4 from 56.0 in August, its strongest reading since July 2021, while services activity rose to 58.7 and manufacturing activity accelerated sharply. The data pointed to stronger private-sector activity but also renewed price and capacity pressures, reinforcing the importance of the Federal Reserve’s rate outlook .
The Federal Reserve had already raised its federal-funds target range by 25 basis points to 3.75%-4% at its September 16 meeting, making the interaction between stronger U.S. growth, inflation pressure and future policy expectations particularly important for foreign exchange markets .
Why the dollar strengthened
The September 23 move was not driven by a single headline. The dollar was firmer even as several overseas economic indicators improved, suggesting that relative monetary-policy expectations remained an important part of the currency adjustment.
The eurozone flash composite PMI rose to 53.1 in September from 52.0 in August, its fastest expansion in almost three and a half years, while services increased to 53.0 from 51.6 and manufacturing held at 52.7.
S&P Global said the stronger activity was broad-based, although rising energy-related price pressures remained a concern for policymakers . That combination of stronger growth and higher price pressure adds complexity for the European Central Bank rather than automatically translating into a stronger euro.
The U.S. data later provided an additional contrast. The stronger-than-expected American PMI reduced the scope for treating recent U.S. weakness as a simple reason for lower rates, while the September Federal Reserve decision had already established a 3.75%-4% policy range. Readers following the connection between the Fed and market rates can also review Investozora’s analysis of the September Fed rate decision and the 10-year Treasury market for broader context.
Euro remains under pressure near $1.14
The euro extended its decline from about $1.1430 on September 22 to slightly above $1.1405 on September 23, according to Chandler’s market assessment. That marked a new low since late July.
Chandler highlighted approximately €1.8 billion in options struck at $1.14 expiring on September 23. The $1.1400 area also coincided with a technical trend line drawn from the late-June and late-July lows. A sustained break of that area, in his technical framework, would expose the $1.1350 region next.
The important distinction is that the euro’s weakness occurred despite the stronger eurozone PMI. The September activity numbers therefore did not prevent the currency from testing a technically important support area, showing why economic growth data and currency performance cannot always be read in isolation.
Yen approaches ¥158 as Japan reopens
Dollar-yen trading remained close to the psychologically important ¥158 level. Chandler noted that the dollar had traded below roughly ¥157.80 in a relatively narrow range on September 22 before moving higher and approaching ¥158 on September 23.
The market had also remained sensitive to reports surrounding possible Bank of Japan monitoring of exchange rates. Chandler identified resistance around ¥158.20, followed by the 200-day moving average near ¥158.45.
The move matters because Japan was returning to the market after its holiday closure, making the reopening another test of how traders would respond to elevated dollar-yen levels. Investozora previously examined the relationship between the yen near ¥157.44 and intervention risk, a useful reference point for understanding why the ¥158 area has attracted attention.
Sterling slips below $1.3280
Sterling fell to almost $1.3320 on September 22 before extending losses through $1.3280 on September 23, according to Chandler. The move placed the pound at its lowest level since July 29.
Options for nearly £500 million at $1.3315 expired that day and, in Chandler’s assessment, may have contributed to selling pressure. He identified the $1.3265-$1.3275 area as the next technical target and argued that the decline did not yet appear technically exhausted.
The UK data provided a mixed backdrop. The preliminary manufacturing PMI increased to 52.0 from 51.7, while the services PMI fell to 51.7 from 52.5 and the composite reading also slipped to 51.7. The combination of stronger manufacturing and softer services left the overall UK private-sector expansion at a three-month low .
Canadian dollar weakens as U.S.-Canada rate spread widens
The Canadian dollar continued to slide, with the greenback moving slightly above the early-August high near C$1.4080 and reaching just above C$1.4090 during September 23 trading.
Chandler also pointed to the U.S. two-year yield premium over Canada, which widened by nearly four basis points toward 150 basis points. In his assessment, that was the widest spread since March 2025 and the March 2025 level itself was the widest since roughly mid-1997. The next technical area he identified was C$1.4100-C$1.4130.
This is one of the clearer examples of the importance of relative rates in the foreign-exchange market: the exchange rate was weakening alongside a widening short-term U.S.-Canada yield differential rather than moving solely on commodity prices.
Australian dollar tests $0.7080
The Australian dollar repeatedly traded below $0.7100 across Asian, European and North American sessions before falling to approximately $0.7080 on September 23. Each dip had previously attracted buyers, but rebounds produced progressively lower highs.
Chandler identified the prior week’s low near $0.7075 and the $0.7045 area as the next downside target if $0.7075 were convincingly broken. Options covering about A$715 million at $0.7050 were also set to expire on September 23.
Before the latest employment data, Chandler noted that futures pricing implied slightly more than an 85% probability of an RBA hike the following week and about a 50% probability of another increase before year-end. He regarded those expectations as potentially demanding and flagged the pending labor-market report as a possible catalyst for reassessment.
That report is now available. The Australian Bureau of Statistics said employment increased by 39,500 in August, but the unemployment rate rose 0.2 percentage point to 4.6%, while the participation rate increased to 67.1% . The RBA’s next monetary-policy decision is scheduled for September 29, with the cash-rate target still at 4.35% before that meeting .
Mexican peso positioning is being squeezed
In emerging markets, Chandler highlighted continued pressure on long Mexican-peso positions. The dollar reached MXN17.3165 on September 22 and climbed toward MXN17.40 on September 23, its strongest level since late July.
The 200-day moving average was near MXN17.42. Chandler noted that momentum indicators were becoming stretched but did not rule out a move toward MXN17.55 if the dollar broke convincingly above MXN17.42.
The key distinction is between an observed technical setup and an assured outcome. The level is a technical reference, not a forecast that the exchange rate must reach MXN17.55.
Yuan remains closely tied to the PBOC fixing
The dollar rose for the first time in four sessions against the offshore yuan on September 22 and, for the first time in five sessions, did not trade below the prior session’s low. It reached approximately CNH6.7090 in European trading on September 23.
Chandler placed the 20-day moving average slightly above CNH6.71 and noted that the dollar had not settled above that level since July 9. The People’s Bank of China fixed the dollar at CNY6.7468 on September 23, compared with CNY6.7459 the previous day, marking the first higher fixing in 11 sessions. Contemporary reporting of the official fixing confirms the CNY6.7468 level .
Rupee falls after five-session advance
The Indian rupee declined for the first time in six sessions. Chandler said the dollar initially opened near INR95.5675 before recovering through the session and finishing close to its highs.
The growth backdrop was stronger. S&P Global Ratings raised its FY2026-27 India growth projection to 7.0% from 6.6%, while Fitch raised its forecast to 6.9% from 6.4%. Both institutions also pointed toward tighter monetary policy in response to inflation pressure . Chandler additionally cited an Asian Development Bank upgrade to 7.0% from 6.6% in July, reflecting stronger-than-expected economic performance.
The significance for foreign exchange is not that stronger growth automatically produces a stronger currency. Instead, stronger growth combined with inflation pressure can alter expectations for the Reserve Bank of India’s policy path and therefore affect the relative attractiveness of rupee assets.
Equities, Treasury yields, gold and oil
Equity markets were mixed on September 23. In Asia-Pacific trading, China, Hong Kong and Singapore declined, while Taiwan, South Korea, Australia and India gained, although several markets finished well below their session highs. Europe’s Stoxx 600 was down roughly 0.2%, while U.S. index futures were narrowly mixed.
Benchmark sovereign yields were comparatively contained in the part of the session covered by Chandler’s report. The U.S. 10-year Treasury yield was near 4.96%, and the Federal Reserve’s official H.15 daily series also records 4.96% for September 23 . Investors tracking the connection between Treasury yields, mortgages and broader financial conditions can see Investozora’s September 23 Treasury-yield coverage for related market context.
Gold recovered from a three-day low slightly below $4,295 on September 22 and returned to around $4,360 during the North American afternoon. It remained inside the previous day’s trading range with a heavier tone on September 23.
Silver also recovered after falling to slightly below $64.60, eventually settling above Monday’s high near $67.05. Chandler described that move as an outside-up day without subsequent follow-through buying, leaving silver near the lower end of the following session’s range. Investozora’s gold-market coverage provides additional context on the interaction between precious metals, rates and the dollar.
November WTI had fallen for a fifth straight session on September 22. It had settled at $100.75 on September 15 and near $90.50 on September 22, moving below its 20-day moving average near $90.55 for the first time since August 7.
On September 23, Chandler described trading as quiet, with prices unable to move significantly above the prior close while remaining above the previous session’s low near $88.65. Investozora has separately tracked the September 23 oil-price move and the changing supply outlook.
U.S. and global PMI data sharpen the rate question
The most important new data point surrounding Chandler’s original note was the later U.S. flash PMI release. The composite index increased from 56.0 in August to 58.4 in September, its strongest reading since July 2021, while services reached 58.7. Manufacturing also accelerated materially, marking a sharp improvement from the 53.9 reading Chandler had been monitoring in the prior three months .
The eurozone’s September composite PMI reached 53.1 from 52.0 in August, while services climbed to 53.0 and manufacturing remained at 52.7. The eurozone composite ended 2025 at 51.5, making the September reading a clear improvement over the level prevailing late last year .
The UK preliminary manufacturing PMI rose to 52.0 from 51.7, but services fell to 51.7 from 52.5 and the composite also slipped to 51.7. Australia’s data were notably weaker: manufacturing fell to 49.3 from 52.0, returning below 50 for the first time since March; services eased to 51.4 from 53.2 and the composite declined to 50.8 from 52.7 .
Taken together, the regional data show a divided global growth picture. The U.S. and eurozone delivered stronger composite readings, the UK slowed modestly and Australia softened. The currency market therefore had multiple reasons to focus on relative policy expectations rather than simply on whether an economy was growing.
The Trump-Xi meeting and the trade-truce clock
The Trump-Xi summit was another major market focus on September 23. Chandler’s original assessment was that expectations for a sweeping breakthrough appeared limited, with the more immediate possibility being an extension of the existing tariff truce.
Reuters reported ahead of the September 24 meeting that investors were watching for signs that the trade truce would be extended, with the existing arrangement due to expire in November . That means the summit had an important market dimension even without an expectation of a comprehensive reset in U.S.-China relations.
The trade issue matters for currencies because tariff policy affects growth expectations, inflation, supply chains and the relative outlook for major economies. It also intersects with oil and other commodity-market developments, making it difficult to isolate one single driver behind any day’s foreign-exchange move.
Central-bank watch: what changed after Chandler’s original note
Chandler’s September 23 note described the central banks of Switzerland, Norway and Sweden as meeting on September 24, with the market gradually moving toward a greater probability of a Norges Bank hike.
That expectation was subsequently resolved. Norges Bank said its September 23 meeting produced a 25-basis-point increase in the policy rate from 4.25% to 4.50%, effective September 25 .
The Swiss National Bank, by contrast, left its policy rate unchanged at 0% on September 24 and said it remained willing to intervene in the foreign-exchange market as necessary .
Sweden’s Riksbank also left its policy rate unchanged at 1.75%, while indicating that stronger economic activity, a weaker krona and higher energy prices meant the rate path could move higher later in the year if the outlook remained unchanged .
Those outcomes reinforce an important point in Chandler’s analysis: the foreign-exchange market was moving ahead of, and around, central-bank decisions rather than waiting only for formal announcements.
What the dollar move means for markets
The September 23 dollar move is best understood as a broad repricing across several relative-value channels rather than as a single-event reaction.
U.S. activity data strengthened materially, while the Federal Reserve was already operating with a 3.75%-4% target range. At the same time, several foreign currencies were approaching technically important levels, including $1.14 in euro-dollar, ¥158 in dollar-yen, $1.3280 in sterling and C$1.4090 in dollar-Canadian.
For investors and businesses, those levels matter because exchange-rate moves can alter the dollar value of overseas revenues, import costs, commodity prices and foreign assets. They do not, however, establish where any currency must trade next.
The most important near-term variables are therefore the confirmation of the U.S. growth and inflation picture, the next Federal Reserve communications, incoming central-bank decisions and any change in the U.S.-China trade arrangement.
Market Snapshot: September 23, 2026
The following snapshot brings together the key market levels and economic indicators highlighted in Marc Chandler’s September 23 analysis. These figures provide a concise view of the dollar, rates, commodities and major currency pairs discussed in the report.
| Market | September 23 Reference |
|---|---|
| EUR/USD | About $1.1405 |
| USD/JPY | Near ¥158 |
| GBP/USD | Below $1.3280 |
| USD/CAD | Above C$1.4090 |
| AUD/USD | About $0.7080 |
| USD/MXN | Near MXN17.40 |
| USD/CNH | Near CNH6.7090 |
| USD/INR | Opened near INR95.5675 |
| U.S. 10-year Treasury | 4.96% official daily rate |
| November WTI | About $90.50 in Chandler’s September 22 close; remained subdued September 23 |
| Gold | Recovered toward $4,360 |
| Silver | Recovered above $67.05 before weakening |
| U.S. Flash Composite PMI | 58.4 in September, up from 56.0 |
This Investozora version retains Marc Chandler’s September 23 market observations and technical framework while clearly separating those observations from economic data and central-bank decisions that became available subsequently. Market levels and technical targets are observations or analytical reference points, not guaranteed future outcomes.