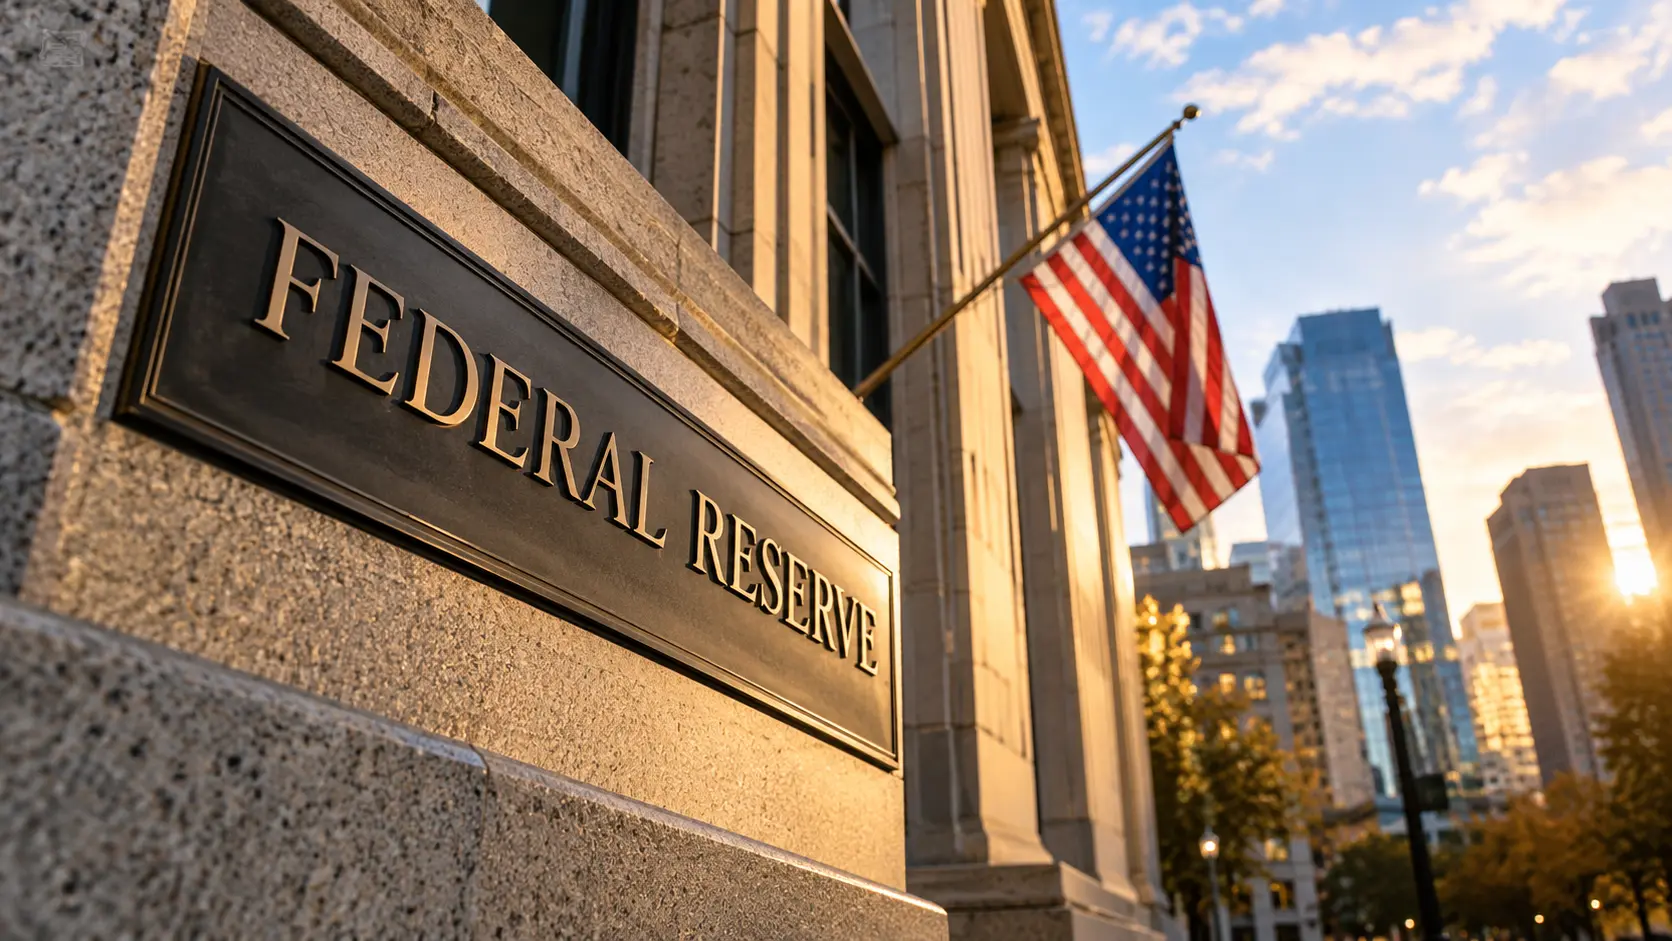
U.S. bank credit growth slowed to a seasonally adjusted annualized rate of 3.1% in September 2026, down from 5.0% in August, as a contraction in banks’ securities holdings offset continued expansion in lending, according to Federal Reserve data released October 9.
The slowdown was concentrated in securities rather than loans. Securities held as bank credit contracted at a 5.9% annualized rate, while loans and leases expanded at a 6.8% rate, a moderation from August’s 9.0% pace. The divergence indicates that weaker growth in banks’ combined credit assets did not reflect an outright contraction in their loan portfolios.
The figures come from the Federal Reserve’s H.8 report, Assets and Liabilities of Commercial Banks in the United States, which measures credit and balance-sheet conditions across U.S. commercial banks.
Securities decline offsets continued lending growth
The Federal Reserve reported total bank credit of $19.876 trillion in September, compared with $19.827 trillion in August, in its seasonally adjusted monthly balance-sheet estimates.
Within that total, securities holdings declined from $5.812 trillion to $5.784 trillion. Loans and leases moved in the opposite direction, increasing from $14.014 trillion to $14.093 trillion.
Those changes show that the reduction in securities holdings partially offset an increase in outstanding lending, limiting growth in total bank credit. The dollar balances are seasonally adjusted estimates, while the headline percentage rates also incorporate adjustments for major structural changes in the banking sector.
Treasury and agency securities contracted at a 6.9% annualized rate in September, following a 2.8% contraction in August. Holdings of other securities also declined, although their contraction moderated from 12.5% to 1.3%.
Business lending remains stronger than real estate credit
Lending activity was uneven across major categories. Commercial and industrial loans, which include credit extended to businesses, grew at a 9.9% annualized rate in September. That was slower than August’s 19.4% increase but remained stronger than overall bank-credit growth.
Real estate loans increased at a 2.1% annualized rate, down from 3.7% in August. Within that category, residential real estate lending grew just 0.4%, while commercial real estate loans expanded at a 3.5% rate.
Consumer loans grew at a 5.0% rate, compared with 4.2% in August. Credit-card and other revolving loans increased at a 3.7% annualized rate after growing just 0.4% in the previous month.
The differences matter because total bank credit combines several types of assets serving different economic purposes. Securities holdings reflect banks’ investment portfolios, while business, real estate and consumer loans more directly measure categories of outstanding credit. A slowdown in the combined total, therefore, does not necessarily mean borrowing is declining across the economy.
Bank credit remains higher than a year earlier
Despite the slower September growth rate, the outstanding amount of bank credit remained above its year-earlier level. The Federal Reserve recorded $18.744 trillion in seasonally adjusted bank credit for September 2025, compared with $19.876 trillion for September 2026.
Based on those published balances, Investozora calculates an approximately 6.0% year-over-year increase, equivalent to about $1.132 trillion. This calculation compares the published monthly levels and is distinct from the Fed’s break-adjusted 3.1% annualized September growth rate.
The distinction is important: the September figure describes the pace of growth during one month expressed at an annual rate. The year-over-year comparison instead measures the difference in outstanding balances across twelve months.
Revisions and structural changes require caution
The September report also included a disclosure that domestically chartered banks divested $5.2 billion in assets to nonbank institutions during the week ended September 30, affecting automobile-related consumer loans and associated balance-sheet items.
Such transactions can change reported loan balances without representing an equivalent change in underlying credit demand. The Federal Reserve adjusts its published growth-rate calculations for qualifying structural activity, helping distinguish changes in banks’ portfolios from certain transfers or reclassifications.
The preceding October 2 release also incorporated benchmarking through the June 2026 Call Report, replacing the earlier March benchmark, along with revisions to underlying data. This makes release-vintage consistency important when comparing historical figures.
For the broader economy, September’s figures point to slower growth in banks’ combined credit assets, accompanied by continuing expansion in lending and declining securities holdings.
They do not independently establish weaker loan demand, tighter credit standards or the direction of the Federal Reserve’s next interest-rate decision. Those questions require additional evidence from lending surveys, economic activity and future policy decisions. The next weekly H.8 release is expected Friday, October 16, 2026, under the Federal Reserve’s regular publication schedule.