The Federal Reserve reported a $140.375 billion increase in bank reserve balances to $3.022 trillion on October 7, while the U.S. Treasury’s cash balance at the central bank fell $98.263 billion to $885.783 billion.
The figures, published in the Fed’s October 8 H.4.1 statistical release, show a sharp reversal from the previous Wednesday, when reserves declined and Treasury’s cash balance increased.
A $28.144 billion reduction in reverse repurchase agreements also coincided with the rebound, making this a broader shift in Federal Reserve liabilities rather than simply a change in Treasury deposits.
Treasury cash decline accompanies reserve rebound
The Treasury General Account (TGA) is the federal government’s main operating account at the Federal Reserve. Its balance changes as the government collects taxes, receives proceeds from borrowing and makes payments.
When the Treasury makes payments into accounts at commercial banks, those transactions generally move funds out of the TGA and into the banking system, increasing reserve balances, all else equal. Tax payments and Treasury-security settlements can operate in the opposite direction.
The latest figures are consistent with that mechanism, although the weekly balance sheet alone cannot establish which individual Treasury transactions accounted for the decline.
The TGA fell from $984.046 billion on September 30 to $885.783 billion on October 7. Over the same period, deposits held by depository institutions at Federal Reserve Banks rose from $2.882 trillion to $3.022 trillion.
The reversal was particularly pronounced because the preceding week showed the opposite pattern. The Fed’s October 1 H.4.1 release recorded an $88.234 billion reduction in bank reserves alongside a $36.729 billion increase in the Treasury’s account.
Reverse repos and other liabilities also shifted
Treasury cash was not the only important change. Reverse repurchase agreements, which appear as liabilities on the Fed’s balance sheet, declined from $361.883 billion to $333.739 billion.
That $28.144 billion reduction can support reserve balances when funds move out of Federal Reserve reverse repo arrangements and into bank deposits, depending on how the transactions settle.
Other deposits at the Fed, excluding Treasury and depository-institution balances, fell $10.023 billion. Meanwhile, Federal Reserve notes outstanding increased $3.334 billion, representing a liability movement that works in the opposite direction for reserve balances, all else equal.
The Fed’s total assets increased by just $4.529 billion, reaching $6.748 trillion. Securities held outright increased $2.223 billion, while mortgage-backed securities holdings were unchanged at $1.898 trillion in the Wednesday snapshot.
This distinction matters because the $140.375 billion increase in reserves was substantially larger than the expansion in the Federal Reserve’s total assets.
It was primarily a change in the composition of liabilities, alongside smaller asset-side movements, rather than an equally large increase in the central bank’s balance sheet.
Fed Balance Sheet Changes: Sept. 30–Oct. 7
Federal Reserve H.4.1, Table 5: Consolidated Statement of Condition of All Federal Reserve Banks. Values in billions of dollars, rounded to three decimals.
| Balance-Sheet Item | Sep. 30 | Oct. 7 | Change |
|---|---|---|---|
| Bank reserve deposits | $2,881.691B | $3,022.066B | +$140.375B |
| Treasury General Account | $984.046B | $885.783B | −$98.263B |
| Reverse repurchase agreements | $361.883B | $333.739B | −$28.144B |
| Other deposits | $249.779B | $239.756B | −$10.023B |
| Total Federal Reserve assets | $6,743.031B | $6,747.560B | +$4.529B |
| Securities held outright | $6,464.597B | $6,466.820B | +$2.223B |
Source: Federal Reserve H.4.1 releases dated October 1 and October 8, 2026, Table 5. These are not seasonally adjusted annualized growth rates.
What Investozora’s calculations show
Using the Federal Reserve’s reported Wednesday balances, Investozora calculates that the $98.263 billion decline in the TGA was equivalent to approximately 70.0% of the $140.375 billion reserve increase.
The calculation is a comparison of magnitudes, not an estimate of how much of the reserve increase was directly caused by Treasury transactions. Similarly, the combined reductions in the TGA and reverse repurchase agreements totaled $126.407 billion, equivalent to about 90.0% of the rise in reserves.
Treasury cash decline / reserve increase
98.263 ÷ 140.375 × 100
Treasury cash + reverse repo decline / reserve increase
(98.263 + 28.144) ÷ 140.375 × 100
Investozora calculations: Based on Federal Reserve H.4.1 balances. Figures rounded to one decimal place. Percentages describe proportions, not verified causal contributions.
Other liabilities and asset movements explain why these two changes alone do not produce the exact reserve increase. These relationships follow the Fed’s consolidated balance-sheet accounting. They do not identify every underlying transaction or its timing.
Fed Balance Sheet: Weekly Changes
September 30–October 7, 2026 · USD billions
Changes compare Wednesday balances, not weekly averages. Negative figures indicate declines. Select or hover over a bar to view the underlying balances.
Source: Federal Reserve H.4.1, October 1 and October 8, 2026, Table 5. Figures rounded to one decimal place.

Weekly averages tell a more moderate story
The Fed’s H.4.1 release also provides averages of daily balances, which differ substantially from the Wednesday snapshots used in the headline. For the week ended October 7, average reserve balances increased $81.569 billion to $3.030 trillion.
The average TGA balance declined $68.421 billion to $880.253 billion. Those smaller average movements suggest that the Wednesday-to-Wednesday changes should not be interpreted as if the entire increase in reserves had persisted throughout the reporting week.
What the figures mean for banking liquidity
Reserve balances represent funds that eligible depository institutions hold at Federal Reserve Banks. They are central to interbank payments, settlement activity and the implementation of monetary policy.
A higher aggregate reserve balance can ease some immediate liquidity pressures, but the total alone does not establish how evenly reserves are distributed across institutions or whether financing conditions have changed materially.
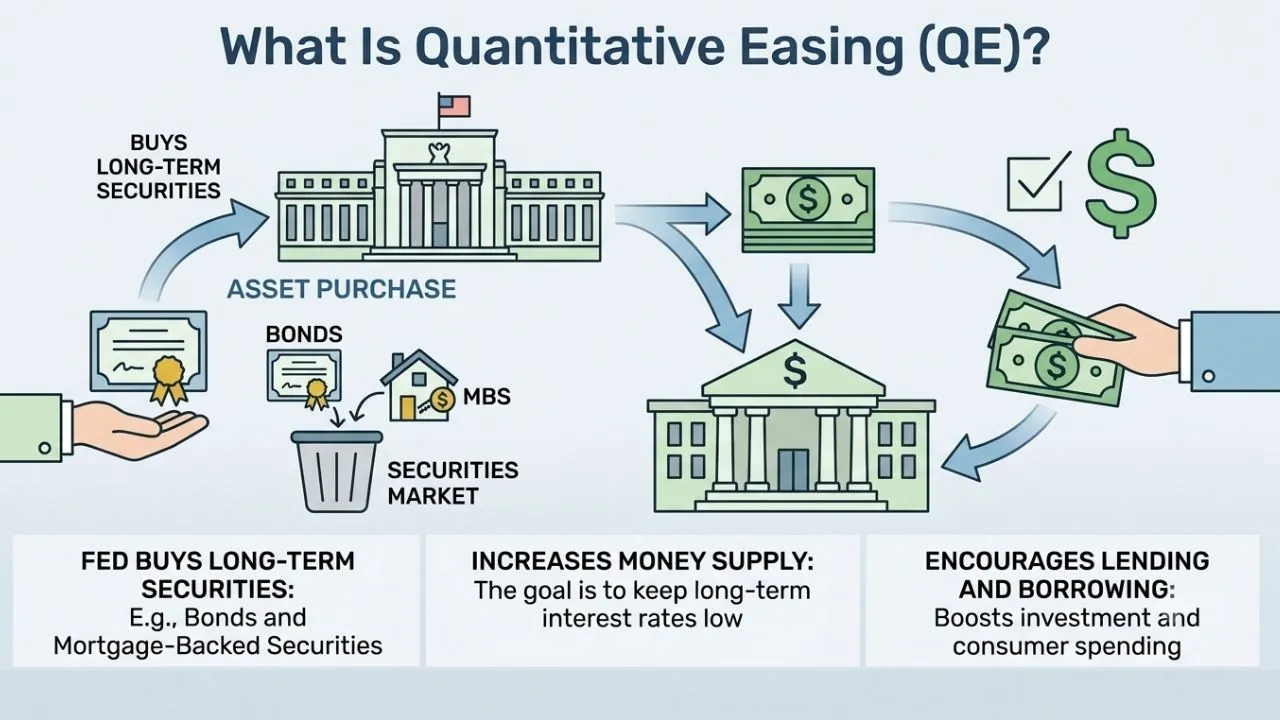
The latest increase also does not establish that the Fed has begun quantitative easing, changed its interest-rate target or committed to additional liquidity provision.
For the next assessment, investors and banks will need to examine whether Treasury cash continues to decline, how reverse repo balances develop and whether the rebound remains visible in subsequent weekly averages.
The next H.4.1 release is scheduled for Thursday, October 15, 2026, when the Fed will publish another snapshot of the assets and liabilities affecting reserve balances.