U.S. industrial production was essentially unchanged in August as factory output fell 0.3%, while stronger utilities production kept the broader industrial index from declining.
The Federal Reserve’s September Industrial Production and Capacity Utilization release, published September 18 at 9:15 a.m. Eastern Time, showed total industrial production at 103.1% of its 2017 average. The index was unchanged on a seasonally adjusted monthly basis after increasing 0.2% in July and stood 1.4% above August 2025.
The headline 0.0% masks a very small increase before rounding. The Fed’s Table 15 industrial-production reliability estimates put the unrounded August change at 0.02%, with the index moving from 103.05 in July to 103.07 in August.
That is an Investozora interpretation of the Fed’s published unrounded figures and explains why the displayed index rose from 103.0 to 103.1 even though the monthly percentage change rounded to zero.
Manufacturing Turns Lower
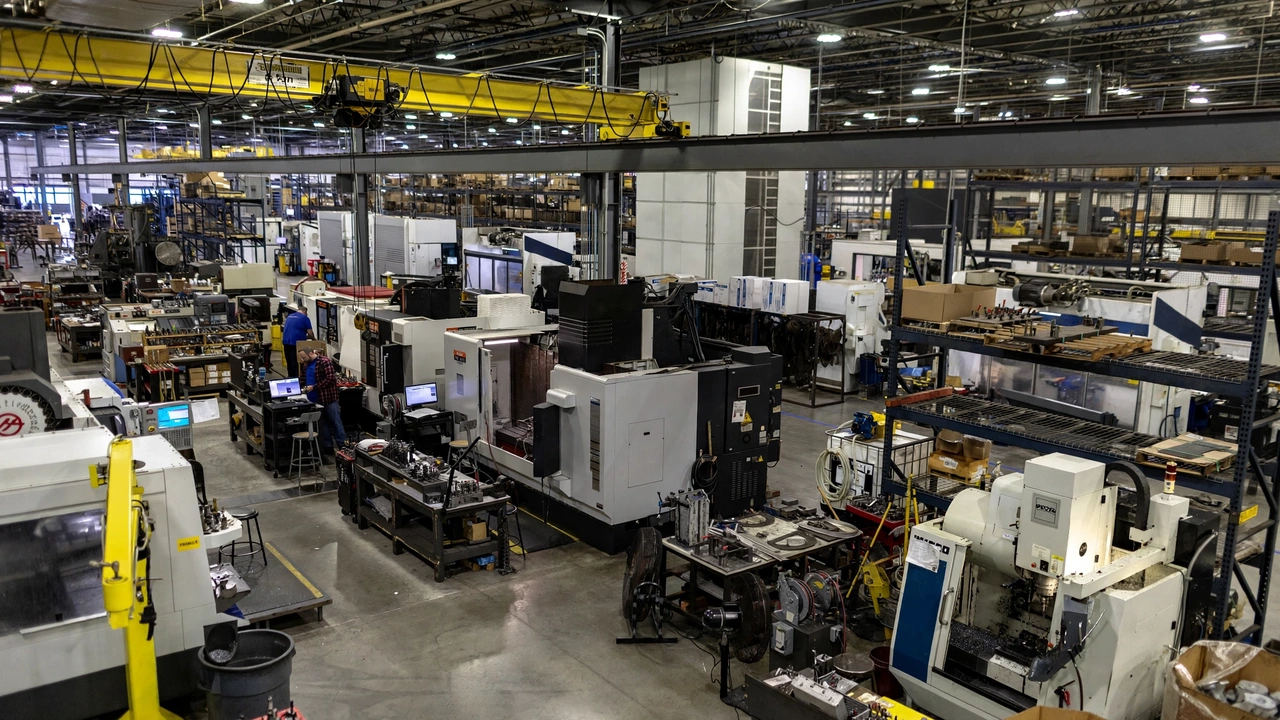
Manufacturing was the main source of weakness. Output fell 0.3% in August, ending seven consecutive monthly increases, though factory production remained 0.9% higher than a year earlier.
The decline was concentrated in durable goods. Durable manufacturing fell 0.5%, while nondurable manufacturing was unchanged. The Fed’s detailed industry production table showed motor vehicles and parts down 1.2%, aerospace and miscellaneous transportation equipment down 1.2%, furniture and related products down 1.4%, and computer and electronic products down 0.5%. Machinery was a notable exception, rising 0.5%.
The broad factory decline adds a national production measure to other recent manufacturing signals. Investozora previously reported that the New York Fed factory gauge fell to 7.6 as price pressures increased, although that regional survey and the Fed’s national industrial-production index measure different things and should not be treated as interchangeable.
Earlier Growth Revised
The latest release also changed part of the recent manufacturing history. In the Fed’s August 18 report covering July production, manufacturing was reported up 0.2% in July after a 0.3% increase in June. The September release still shows July manufacturing growth of 0.2%, but June has now been revised down to 0.1%.
For total industrial production, June was also revised from 0.3% growth to 0.2%, while May was revised from unchanged to a 0.1% increase. That revision matters because it makes the summer production path slightly weaker than initially reported even before August’s manufacturing decline.
Utilities Prevent Decline
Overall industrial production avoided a contraction because the other major industry groups increased. Utilities output jumped 1.8% in August, including a 2.1% rise in electric utilities, while natural-gas utilities fell 0.5%. Mining increased 0.1%.
Manufacturing carries a 75.89% weight in the industrial-production index, compared with 12.40% for utilities and 11.71% for mining. The much larger percentage gain in utilities therefore helped offset the smaller percentage decline in the much larger manufacturing sector.
Among market groups, business equipment fell 0.5%, construction supplies declined 0.7%, and defense and space equipment dropped 1.2%. Materials output increased 0.2%, supported by a 0.7% increase in energy materials.
These activity figures also arrive alongside the Federal Reserve’s broader economic projections, which Investozora examined in its report on the Fed’s 2026 growth forecast and inflation outlook. One month of industrial-production data does not by itself establish a broader economic slowdown or determine the path of monetary policy.
Factory Utilization Falls
Total industry capacity utilization held at 76.3%, which was 3.1 percentage points below its 1972–2025 average. Manufacturing utilization, however, declined from 76.0% in July to 75.7% in August, a 0.3-percentage-point decrease. The August rate was 2.5 percentage points below manufacturing’s long-run average.
The report therefore shows a divergence inside U.S. industry: factory production weakened broadly, particularly across durable goods, while utilities provided enough offset to leave total output essentially flat.
The next monthly G.17 report is scheduled for October 16 at 9:15 a.m. Eastern Time. The Fed will also issue its annual revision on November 24 at noon, incorporating new benchmark data, revised seasonal factors and other methodological updates that could change the historical industrial-production series.