U.S. retail sales rose 0.8% in September as gasoline station receipts jumped 6.4%, while August’s previously reported increase was revised higher to 1.3%, according to figures released Thursday by the U.S. Census Bureau.
The September report showed total retail and food services sales reaching a seasonally adjusted $745.0 billion, up from a revised $739.3 billion in August. Sales were 6.3% higher than a year earlier, indicating continued growth in consumer spending measured in current dollars.
But the headline increase masked a substantial difference between gasoline-related spending and the broader retail economy. Sales excluding gasoline stations rose just 0.2% in September, compared with a 1.0% increase in August. Excluding both motor vehicles and gasoline stations, sales also advanced only 0.2%.
The figures suggest that higher spending at gasoline stations accounted for much of September’s headline growth, while purchases across the rest of the retail sector increased more slowly.
Gasoline Drives Sales Growth
Gasoline station sales climbed 6.4% in September, following a 4.0% increase in August, according to Census tables. Receipts at gasoline stations reached approximately $68.0 billion, up from $64.0 billion a month earlier. Compared with September 2025, gasoline station sales were 28.1% higher.
September Retail Sales by Category
Monthly percentage change, seasonally adjusted
| Retail Sales Category | Monthly Change |
|---|---|
| Gasoline stations | +6.4% |
| Furniture and home furnishings stores | +1.3% |
| Food services and drinking places | +1.1% |
| Electronics and appliance stores | +0.6% |
| Nonstore retailers | +0.3% |
| Total retail and food services sales | +0.8% |
| Total excluding gasoline stations | +0.2% |
| Building material and garden equipment stores | -0.6% |
Source: U.S. Census Bureau, Table 2 , September 2026 Advance Monthly Retail Trade Survey, released October 15, 2026. Monthly rates are seasonally adjusted, nominal, and not inflation-adjusted.

The category’s increase was particularly significant because the overall retail sales report measures the dollar value of purchases rather than inflation-adjusted consumption. Higher gasoline prices can therefore raise reported station sales without a corresponding increase in the volume of fuel purchased.
An Investozora calculation using the Census Bureau’s seasonally adjusted estimates shows that gasoline station receipts increased by approximately $4.1 billion between August and September. That compares with an increase of approximately $5.7 billion in total retail and food services sales.
Gasoline Stations Accounted for 71.4% of September’s Retail Sales Increase
Although gasoline stations represented only 9.1% of total U.S. retail and food services sales in September 2026, they accounted for 71.4% of the month’s net dollar increase, according to an original Investozora calculation using seasonally adjusted U.S. Census Bureau estimates.
What the calculation reveals: Of the estimated $5.699 billion increase in September retail and food services sales, gasoline stations accounted for $4.071 billion. All other included businesses combined contributed a net $1.628 billion, equivalent to 28.6% of the total increase. Gasoline stations’ 9.1% share of September sales is calculated as 68,021 divided by 745,021, multiplied by 100.
Methodology and limitations: Investozora subtracted the August 2026 preliminary estimates from the September 2026 advance estimates within each matching Census series, then divided the gasoline station change by the total change. All calculations use seasonally adjusted nominal sales in millions of U.S. dollars, from the October 15, 2026 data vintage. Results are rounded to one decimal place. The 71.4% figure is a share of the net change in estimated sales, not a measure of inflation-adjusted consumption or the causal contribution of gasoline prices. Estimates are subject to sampling uncertainty and future revisions; no separate confidence interval has been established for this ratio.
Source: Census Table 1 , Advance Monthly Retail Trade Survey, September 2026, release CB26-165, October 15, 2026. See also the release archive . The percentage shares and dollar-change decomposition are independent Investozora calculations, not figures separately published by the Census Bureau.
The comparison indicates that gasoline stations represented roughly 71% of the net monthly increase in reported sales. This is an accounting comparison of published estimates, not evidence that gasoline prices alone caused the increase.
Elsewhere, retail activity was mixed. Furniture and home furnishings stores recorded a 1.3% monthly increase, while electronics and appliance retailers posted a 0.6% gain. Food services and drinking places, including restaurants, reported sales growth of 1.1%.
Nonstore retailers, a category that includes online merchants, registered a smaller 0.3% increase following a 2.0% rise in August. Meanwhile, building material and garden equipment stores reported a 0.6% decline. General merchandise stores fell 0.1%, sporting goods and related retailers declined 0.5%, and miscellaneous store retailers dropped 3.0%.
Clothing and accessories store sales were unchanged. The differing performances underscore why September’s overall 0.8% gain should not be interpreted as equally strong demand across every retail category.
August Growth Revised Higher
The Census Bureau revised August’s monthly retail sales increase from 1.1% to 1.3%, an upward adjustment of 0.2 percentage points. The revised August sales level of $739.3 billion provides the comparison base for September’s advance estimate. Although September’s 0.8% gain was smaller than August’s revised 1.3% increase, the two readings together indicate consecutive monthly advances in nominal retail spending.
The latest report also showed that total retail and food services sales increased 5.5% during July through September compared with the corresponding three-month period in 2025. That quarterly comparison provides additional context for consumer activity, although it does not establish the inflation-adjusted rate of household consumption growth used in gross domestic product calculations.
The Census Bureau also disclosed that historical monthly retail estimates had been revised on September 28 following corrections and the incorporation of results from the 2023 and 2024 Annual Integrated Economic Survey. Those broader revisions are distinct from the latest monthly adjustment to August’s growth rate and matter when comparing the newest figures with previously published historical data.
Inflation Complicates Spending Picture
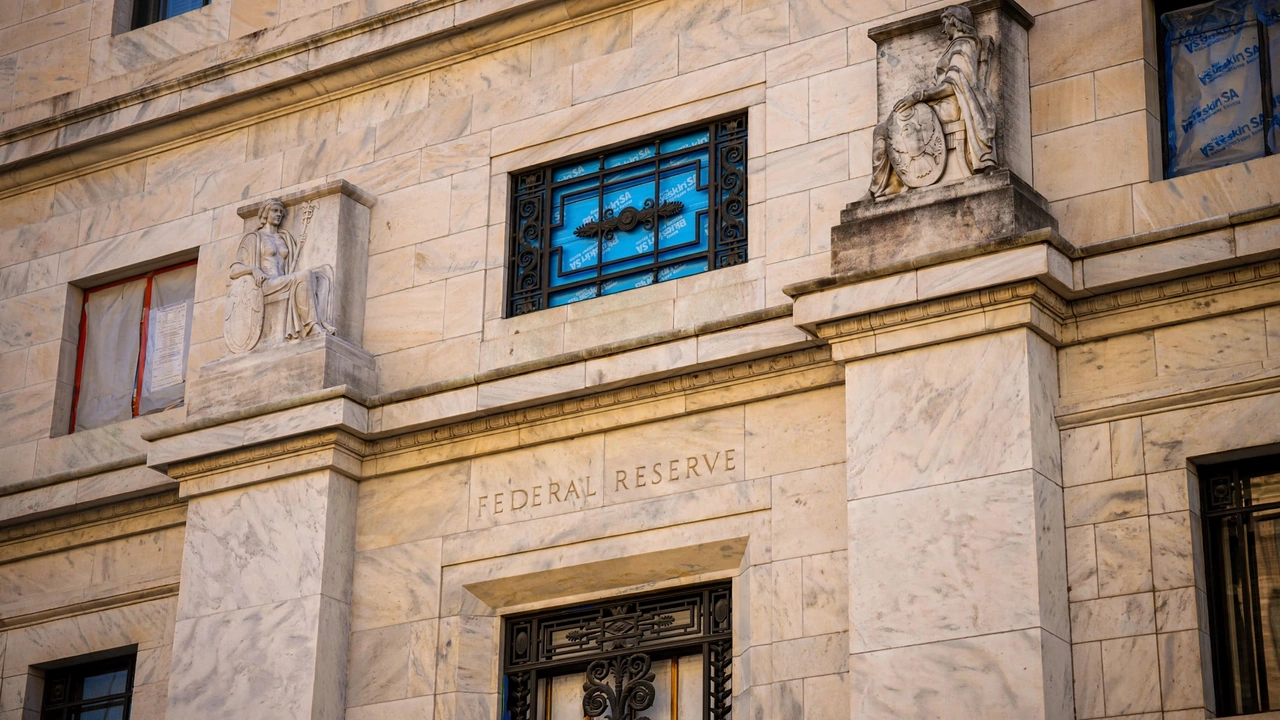
September’s retail figures arrive as the Federal Reserve continues assessing the balance between consumer demand, inflation and economic growth. The key distinction is that the retail report measures sales in nominal dollars. Its seasonally adjusted estimates account for recurring calendar patterns but do not remove the effects of price changes.
Consequently, higher spending can reflect rising prices, greater quantities purchased or some combination of the two. The sharp increase in gasoline station receipts is especially relevant when interpreting the latest figures because movements in fuel prices can significantly influence the dollar value of gasoline purchases.
The Federal Reserve outlook also depends on inflation, employment and other economic indicators rather than retail sales alone. For policymakers, the modest 0.2% increase in sales excluding gasoline stations provides a different perspective from the stronger headline number. It suggests that much of September’s nominal spending growth was concentrated in one category rather than distributed evenly across retail activity.
Still, the report does not by itself establish whether inflation-adjusted consumption increased or decreased during the month. A fuller assessment requires consumer price information and the Bureau of Economic Analysis’s measures of personal consumption expenditures.
What Comes Next
The Census Bureau’s September figures are advance estimates based on a sample of approximately 4,800 retail and food services firms, weighted to represent a much larger national business population. The agency reported a sampling margin of error of plus or minus 0.4 percentage points for September’s monthly increase at the 90% confidence level.
That uncertainty, along with potential revisions to initial estimates, makes the next release important for evaluating whether September’s spending pattern persists. The October 2026 advance retail sales report is scheduled for November 17 at 8:30 a.m. Eastern Standard Time, according to the release calendar.
The next report will provide an initial assessment of October activity and updated estimates for September, offering a clearer picture of whether retail growth remains concentrated in gasoline spending or becomes more broadly distributed across consumer categories.