U.S. wholesale prices jumped 1.3% in September, their biggest monthly increase in more than four years, as gasoline prices surged 20.3% and energy costs drove a sharp acceleration in producer inflation, according to figures released Thursday by the Bureau of Labor Statistics.
The seasonally adjusted producer price report, published October 15, showed that the Producer Price Index (PPI) for final demand accelerated from a revised 0.5% increase in August and a 0.2% gain in July. September’s advance was the largest since the 1.7% increase recorded in March 2022.
Wholesale prices climbed 6.3% over the 12 months through September, on an unadjusted basis, marking the largest annual increase since December 2022. The report also showed that inflation extended beyond energy: prices excluding food, energy and trade services rose 0.5% for the month, up from 0.3% in August.
Gasoline Drives Wholesale Price Surge
Prices for final demand goods rose 2.6% in September, the largest monthly increase since the current series began in December 2009. More than 80% of that advance was attributable to energy prices, which jumped 10.8%. Gasoline prices surged 20.3%, accounting for half of the monthly increase in the final demand goods index, according to the BLS commodity price tables.
The energy increase was not limited to gasoline. Diesel fuel prices climbed 21.0%, while crude petroleum prices jumped 28.3%. The report also identified higher prices for jet fuel, residential electricity and several other energy products.
Food prices contributed additional pressure, rising 1.2% during September. Fresh and dry vegetable prices climbed 41.0%, while grain prices increased 17.4%. Some categories moved in the opposite direction, with chicken egg prices dropping 39.7%. Prices for goods excluding food and energy rose a more moderate 0.3%, demonstrating the difference between the sharp energy-driven headline increase and underlying goods-price movements.
The concentration of the goods increase in energy is an important distinction. Although energy prices can influence transportation, distribution and production expenses, the producer-price report does not establish how much of September’s increase businesses will ultimately pass through to consumers.
Service Prices Add Inflation Pressure
Producer inflation was not confined to physical goods. Prices for final demand services increased 0.8% in September, matching April’s monthly gain. Nearly half of the services increase was attributable to a 1.4% rise in margins for trade services, which measure changes in margins received by wholesalers and retailers rather than the full selling prices of goods.
Transportation and warehousing service prices increased 3.4%, while services excluding trade, transportation and warehousing advanced 0.3%. Margins for machinery and vehicle wholesaling climbed 3.9%, accounting for more than one-fifth of the monthly increase in the services index. Truck freight transportation, traveler accommodation and airline passenger services also recorded higher prices.
The combination of rising goods costs and stronger service prices indicates that September’s producer inflation was broader than a single gasoline-price movement. However, the underlying measures differed considerably. The index excluding food, energy and trade services rose 0.5% for the month and 5.0% from a year earlier, below the 6.3% annual increase in the overall final demand index.
Earlier Inflation Figures Revised Higher
The September report also revised previously published producer-price data, changing the comparison against which the latest inflation acceleration should be assessed. August’s monthly increase in final demand prices was revised to 0.5%, compared with the 0.4% initially reported in September. July’s increase was revised to 0.2% from 0.1%.
U.S. Producer Price Inflation Accelerates
Final demand PPI, monthly percentage change, seasonally adjusted.
| Month | Monthly PPI | Data Status |
|---|---|---|
| July 2026 | +0.2% | Revised |
| August 2026 | +0.5% | Revised |
| September 2026 | +1.3% | Preliminary |
Source: U.S. Bureau of Labor Statistics , October 15, 2026. July and August revised; September preliminary.

The revisions mean wholesale prices had already been rising somewhat faster than the initial figures suggested before September’s larger increase. The BLS said figures covering May through August were revised to incorporate late reports and corrections from survey respondents. September’s figures remain preliminary and are subject to further revisions under the agency’s normal data-publication process.
U.S. Producer Inflation: Original Momentum Analysis
Investozora calculations based on revised Bureau of Labor Statistics data show how sharply the monthly rate of U.S. producer-price inflation accelerated in September 2026.
Official Monthly Inflation Rates
July 2026
+0.2%
Revised
August 2026
+0.5%
Revised
September 2026
+1.3%
Preliminary
Investozora Original Calculations
September versus August
+0.8 percentage points
1.3% − 0.5% = 0.8 pp
September versus July
+1.1 percentage points
1.3% − 0.2% = 1.1 pp
The monthly producer inflation rate accelerated by 0.8 percentage points from August to September and was 1.1 percentage points higher than in July. These comparisons measure changes in monthly inflation rates, not cumulative price increases.
Headline Versus Underlying Inflation
Headline PPI minus PPI excluding food, energy and trade services
+0.8 pp
1.3% − 0.5% = 0.8 percentage points
This spread compares two published monthly inflation measures. It does not quantify energy’s contribution to headline inflation or establish the cause of the difference.
Research Interpretation
September’s producer-price increase was substantially faster than the revised monthly readings for July and August. The divergence between headline and the measure excluding food, energy and trade services also shows why the broad inflation reading should not be interpreted as a uniform increase across all producer-price categories.
The data establish stronger monthly wholesale inflation but do not independently determine future consumer inflation, business pricing decisions or Federal Reserve policy outcomes.
Methodology And Data Vintage
Investozora calculated the differences using BLS-published, seasonally adjusted monthly percentage changes from the September 2026 Producer Price Index release. July and August figures incorporate revisions available in that release. September data are preliminary.
Each calculation subtracts one published monthly rate from another. Results are expressed in percentage points, using official rates rounded to one decimal place. No annualization or causal attribution is applied. Subsequent BLS revisions may change these results.
Source: BLS September 2026 PPI release , Table A, USDL 26-1576, October 15, 2026. Original calculations and interpretation: Investozora.
Higher Costs Reach Production Stages
The detailed PPI data also showed substantial increases in prices paid at earlier stages of production. Prices for processed goods used as intermediate inputs rose 2.5%, while unprocessed goods for intermediate demand jumped 8.4%, the largest monthly increase in that category since February 2022.
More than 80% of the unprocessed-goods increase was attributable to energy materials, whose prices surged 22.2%. These measures track price changes for materials and services purchased by businesses during production rather than goods sold directly to final users.
Their increases indicate significant upstream cost pressure, particularly in energy-intensive supply chains. They do not, however, establish that equivalent price increases will occur for finished products.
What This Means For Fed
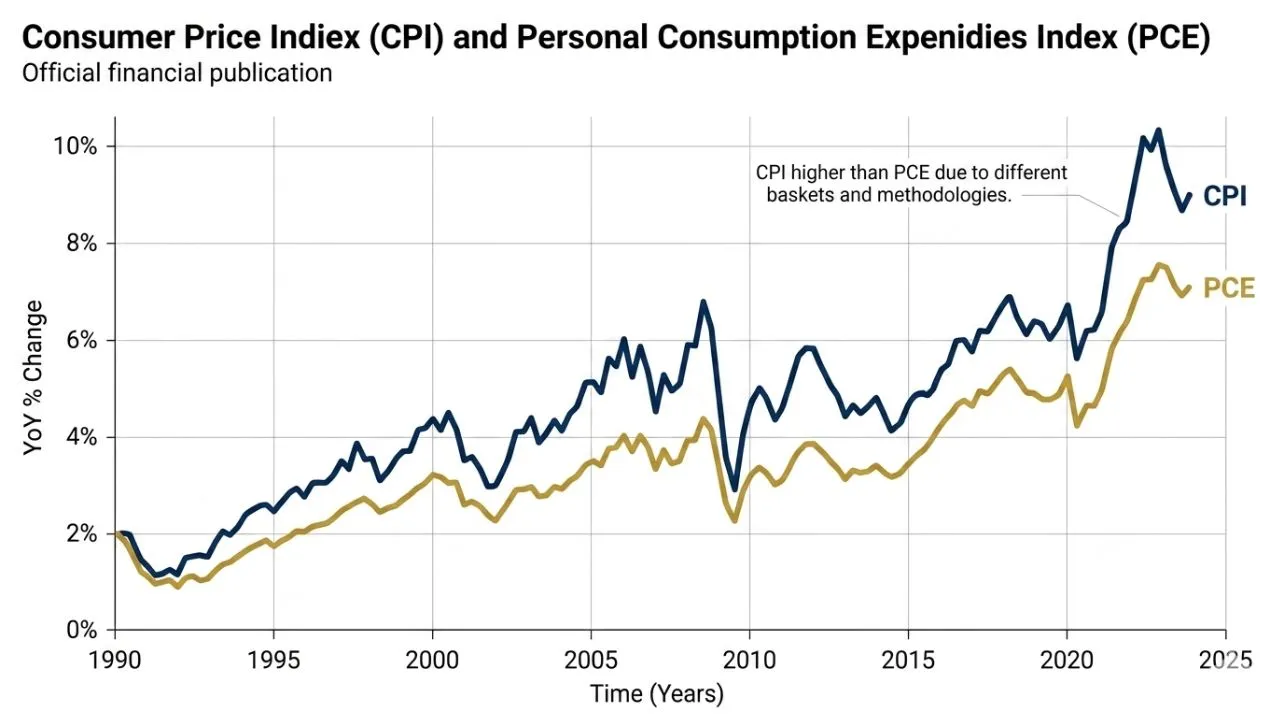
The latest producer-price figures add to the inflation evidence facing the Federal Reserve as policymakers assess economic conditions and the appropriate path for interest rates. Producer prices represent a different stage of economic activity from the Consumer Price Index and the Personal Consumption Expenditures price index. As a result, a 1.3% monthly PPI increase cannot be interpreted as an equivalent rise in consumer inflation.
The divergence between the overall producer-price increase and the smaller gain excluding food, energy and trade services is particularly relevant for interpreting how much of September’s acceleration reflected volatile energy costs. The inflation figures also arrive amid ongoing attention to the Fed rate outlook and the relationship between persistent price pressures and monetary policy.
September’s report provides evidence of renewed wholesale-price pressure, but it does not determine the Federal Reserve’s next interest-rate decision. Policymakers must consider consumer inflation, employment, economic activity and financial conditions alongside producer prices.
The BLS has scheduled its next Producer Price Index report, covering October 2026, for November 13, 2026, at 8:30 a.m. Eastern Time. The release will provide the next official indication of whether September’s energy-led acceleration persisted or moderated.