The Bureau of Economic Analysis has substantially rewritten the inflation record for July. When BEA first published July’s Personal Income and Outlays report on August 26, it said the PCE price index excluding food and energy rose 3.3% from a year earlier. The same original July 2026 BEA release reported a 0.2% monthly increase in core PCE.
After BEA’s annual update of the National Economic Accounts, July core inflation now stands at 3.0% year over year, while the July monthly increase has been revised to 0.1%. The revised history appears in BEA’s September 30 Personal Income and Outlays release, which also reports August core PCE inflation at 3.0%.
That 0.3-percentage-point change in July’s annual core rate is not simply the result of one newly observed month. BEA has recalculated a much larger section of the economic accounts using updated source data, revised seasonal factors and changes to how prices are derived for several categories of consumer spending.
And an important limitation emerges from the documents: BEA does not provide evidence in the September 30 PCE release showing exactly how much of July’s 0.3-point core PCE revision came from each individual methodology change.
The July numbers changed in more places than the headline core rate
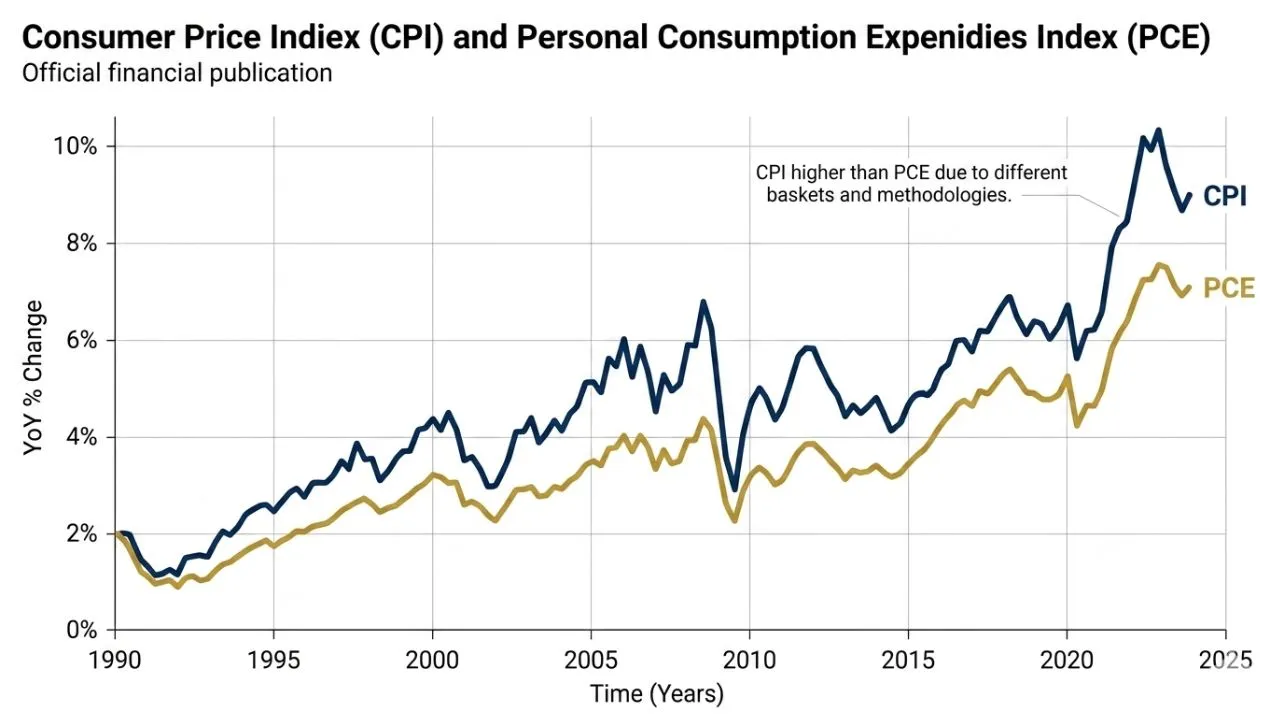
A direct comparison of the two official releases shows how extensively July was revised. On August 26, BEA reported July headline PCE inflation at 3.7% year over year and core PCE at 3.3%. The revised September 30 series puts July headline inflation at 3.4% and core inflation at 3.0%. Both annual rates therefore fell by 0.3 percentage point between vintages.
The monthly history changed as well:
| July measure | Aug. 26 vintage | Sept. 30 revised vintage |
|---|---|---|
| Core PCE price index, monthly | 0.2% | 0.1% |
| Headline PCE price index, monthly | 0.2% | 0.1% |
| Current-dollar PCE | 0.2% | 0.1% |
| Real PCE | 0.0%* | 0.1% |
| Personal income | 0.4% | 0.3% |
| Disposable personal income | 0.5% | 0.4% |
The original release described real PCE as increasing by less than 0.1%; its summary table rounded the change to 0.0%. Those figures are directly reproducible from page 3 of the original July release PDF and page 3 of the revised August release PDF.
This comparison is important because it shows that the revision was not a narrow correction to the published year-over-year core inflation number. BEA changed the underlying monthly economic history on which that number sits. Investozora’s coverage of the new August core PCE reading provides the companion analysis of the newly reported month itself.
Why a 0.1-point monthly revision can coexist with a 0.3-point annual revision
The arithmetic needs care. July’s monthly core PCE rate was reduced from 0.2% to 0.1%, but that does not mean that single 0.1-percentage-point revision mechanically caused the annual rate to fall from 3.3% to 3.0%.
A year-over-year inflation rate compares the price-index level in July 2026 with the level in July 2025. BEA says the September release contains annual-update revisions to monthly personal income and outlays estimates beginning with January 2021.
The revised 3.0% rate therefore comes from a recalculated historical price-index series, not just a different estimate for July 2026. That distinction is the first major information gain from comparing the two vintages directly: the 30-basis-point drop cannot be reconstructed by subtracting the revised July monthly rate from the old one. Earlier months and the historical index levels used in the 12-month comparison were also inside BEA’s revision window.
BEA changed how several PCE components are deflated
BEA had disclosed the main methodological changes months before the September update. In its June 24 Preview of the 2026 Annual Update of the National Economic Accounts, the agency said annual updates can incorporate more complete source data, improved methodologies and recalculated seasonal factors.
Three changes are particularly relevant to consumer prices. For portfolio management and investment advice services, BEA replaced a method that deflated nominal spending using a producer price index with a quantity approach based on a BLS Current Employment Statistics-derived extrapolator. BEA said the change was designed to better reflect the timing and quantity of services actually consumed.
For legal services, beginning in 2024 BEA replaced the CPI for legal services with a composite index built from detailed producer price indexes for legal services consumed by households. The agency said the previously used unpublished CPI observations did not meet BLS publication-quality guidelines and had shown erratic movements that could not be corroborated with other source data.
For computer software and accessories, BEA replaced reliance on the CPI for that category with a composite drawing from the CPI as well as producer price indexes for game software publishing, hosting and other IT-infrastructure services.
These changes matter because a PCE price index is built by combining price movements across consumer expenditures. Changing the deflator used for a component can alter the measured price movement for that component and, through its weight in PCE, the aggregate index.
What the BEA documents do not prove
There is a tempting but unsupported conclusion to avoid: that one of those three methodology changes alone “caused” July core PCE to fall from 3.3% to 3.0%. The primary records reviewed for this analysis do not provide a decomposition assigning, for example, a specific number of basis points of the July core revision to legal services, another amount to portfolio management and another amount to software.
BEA’s broader 2026 annual-update documentation says the update incorporated newer and more detailed source data alongside methodological improvements, and that its revision period extends across recent years.
So the defensible conclusion is narrower: the revised July inflation rate emerged from BEA’s annual re-estimation of the accounts, which included both new source information and methodological changes.
The published documents establish the categories of methodology that changed, but they do not establish a precise causal contribution for each category to July’s 0.3-point core revision. That is materially different from saying BEA simply “changed the formula and inflation fell.”
The revision changes the historical baseline the Fed had at its September meeting
There is also a timing consequence. The Federal Reserve raised its target range to 3.75%–4.00% on September 16, two weeks before BEA published the revised PCE history. Investozora’s September Fed rate-decision analysis recorded the inflation information available at that point, when July core PCE was still officially 3.3%.
The September 30 revision does not mean the Fed made its earlier decision using information that was known to be wrong. It means the official historical estimate changed after that decision as BEA incorporated a newer data vintage.
Nor does the revised 3.0% July figure rewrite the Fed’s September projections automatically. Those projections were made with the information available when the FOMC met; Investozora’s analysis of the Fed’s September growth and inflation projections documents that historical forecast set.
BEA has already identified the next point at which the PCE record can change again: Personal Income and Outlays for September 2026 is scheduled for October 29 at 8:30 a.m. EDT. The agency also explicitly warns that each current PCE release will be superseded when newer estimates arrive.