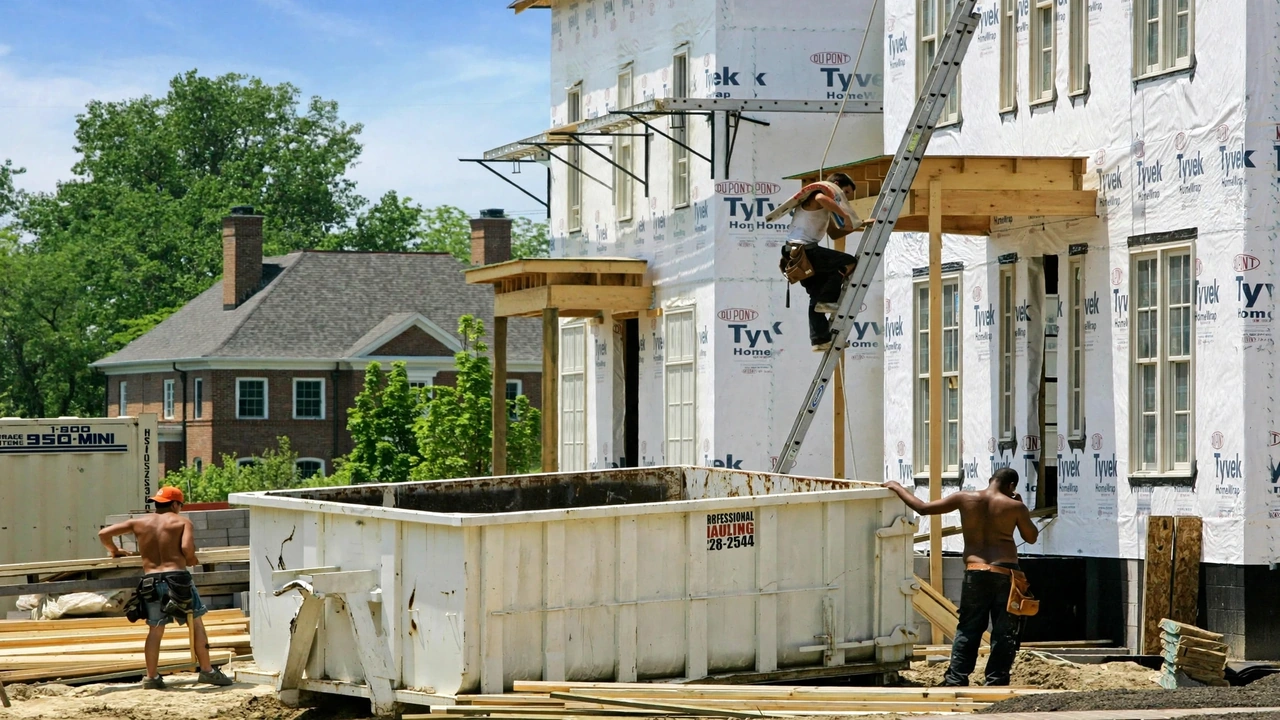
The U.S. economy faces two important tests in the week of October 19–23, as fresh housing construction figures and quarterly wage data offer a closer look at residential investment and workers’ earnings following September’s inflation surge.
The Census Bureau is scheduled to publish September housing starts on Tuesday, October 20, while the Bureau of Labor Statistics (BLS) will release third-quarter usual weekly earnings on Wednesday, October 21. Both reports are due at 10 a.m. Eastern Time, according to their official release calendars.
The figures arrive after government data showed housing construction weakening in August and inflation-adjusted hourly earnings falling in September. Together, the upcoming releases could help clarify whether construction activity and household purchasing power are showing signs of improvement or further pressure.
Housing Starts Face Another Test
U.S. housing starts declined 2.6% in August to a seasonally adjusted annual rate of 1.275 million units, down from July’s revised 1.309 million, according to the Census Bureau’s construction report published September 17. The headline decline concealed differences between housing categories.
Single-family starts rose 7.6% to an annualized 918,000 units, compared with 853,000 in July. Meanwhile, total building permits fell 2.7% to 1.394 million units, suggesting that the pace of future construction authorizations remained under pressure. Housing completions also declined 11.9% to an annualized 1.128 million units in August.
The September report will establish whether the improvement in single-family construction continued and whether the broader market recovered from August’s decline. Building permits will provide a separate indication of projects authorized for construction, while completions will help assess the flow of newly finished housing.
Why Housing Starts Diverged
Investozora’s calculation of the August 2026 construction figures shows that an increase in single-family housing starts was more than offset by a decline in other housing units. The analysis compares the latest published seasonally adjusted annual rates with revised July estimates.
Reproducible Calculation
What the Calculation Establishes
The overall annualized housing-starts rate fell by 34,000 units even as the single-family rate increased by 65,000. The implied rate for non-single-family units declined by 99,000. This arithmetic explains the divergence between the reported totals, but does not establish the causes of the changes.
Methodology and Limitations
Investozora subtracted published single-family housing-starts rates from total housing-starts rates for July and August 2026, then compared the resulting values. The residual covers all housing units outside the single-family category, not solely buildings containing five or more units. All values are seasonally adjusted annual rates, not actual monthly construction counts. Figures are subject to revision and rounding.
The Census Bureau reported the August decline in total starts as 2.6% (±12.0 percentage points) and the single-family increase as 7.6% (±14.0 percentage points). Neither monthly percentage change was statistically significant at the 90% confidence level. The derived 99,000-unit difference is an arithmetic residual, not a separately estimated statistically significant change.
Source: U.S. Census Bureau, August 2026 release , published September 17, 2026. The calculations use published seasonally adjusted annual rates.

These measures should not be treated as interchangeable. Starts measure construction activity beginning, permits reflect authorizations, and completions measure units reaching the end of construction. The figures also provide context for the housing starts increase in the single-family category reported for August.
Wage Data Meet Inflation Pressure
Wednesday’s earnings release will provide another perspective on U.S. labor-market conditions. In the second quarter, median usual weekly earnings for full-time wage and salary workers reached $1,251, up 4.6% from a year earlier, according to the BLS earnings report.
Consumer prices increased 3.9% over the same year-earlier comparison period, meaning reported median nominal weekly earnings grew faster than headline consumer inflation during that period. However, more recent figures indicate that inflation has intensified pressure on workers’ purchasing power.
The BLS reported that real earnings fell 0.5% in September from August, seasonally adjusted, as nominal average hourly earnings rose 0.1% while consumer prices increased 0.6%. Real average hourly earnings were also 0.7% lower than a year earlier.
The distinction between the reports is important. Wednesday’s quarterly release measures median usual earnings using household survey responses, while the monthly real earnings report measures inflation-adjusted average pay using payroll data and consumer price indexes.
The figures cover different populations and use different statistical methods, so they cannot be compared directly as identical wage measures. The third-quarter report will show whether median weekly pay maintained its earlier annual growth and how earnings varied across worker groups.
What Markets Will Watch
Housing starts and earnings data address different parts of the economy, but both contribute to the broader assessment of economic momentum. A recovery in housing starts alongside stronger building permits would suggest improving construction activity. Another decline would instead reinforce concerns about the pace of residential development.
For workers, nominal wage gains alone will not establish whether purchasing power improved. Earnings must also be assessed against inflation and the relevant measurement period. The releases will provide additional evidence ahead of the Federal Reserve’s October meeting, although neither report alone can determine the direction of monetary policy.
The first test arrives Tuesday with September housing starts. Wednesday’s earnings figures will then provide a separate measure of how pay evolved during the third quarter.