The 10-year Treasury yield recently reached 4.54% after touching 4.58% earlier in the week, its highest level in about seven weeks.
Driven by renewed Middle East tensions, rising oil prices, and a Federal Reserve that markets now expect to hike rather than cut rates this year, the 10-year Treasury yield has climbed to its highest point in roughly two months. For anyone holding stocks, a mortgage, or a savings account, this single number matters more than it might seem.
Why one bond yield moves so much
The 10-year Treasury note functions as the benchmark risk-free rate for the entire U.S. economy, which is why movements in it ripple through treasury bill note bond markets and far beyond them.
Mortgage rates are priced directly off this yield, so as it rose from around 4.5% in mid-June to nearly 4.58% in early July, mortgage rates moved with it.
Equity valuations are affected too, since investors discount future company earnings against this benchmark, and a higher discount rate mechanically lowers what those future earnings are worth today. That’s a structural relationship, not a prediction about any single stock.
The recent climb has a clear, traceable cause. The yield rose alongside escalating conflict between the U.S. and Iran, which pushed oil prices higher and revived inflation concerns just as the Fed was already signaling a more hawkish stance.
New York Fed President John Williams noted separately that demand fueled by artificial intelligence investment is among the factors he’s watching most closely on the inflation side, an example of how the wall street ai real economy narrative and traditional bond-market inflation concerns are increasingly intertwined.
As of July 10, the yield had eased slightly to around 4.54%, following reports that the U.S. and Iran would continue peace negotiations, illustrating how quickly this figure can move on geopolitical developments alone.
What this means for equity valuations broadly
Sectors most sensitive to interest rates, generally those trading on long-dated future earnings rather than current cash flow, tend to feel the pressure from rising yields most acutely. This is a well-documented mechanical relationship in how equities are priced, not a forecast about which specific companies will outperform.
Markets are currently pricing a roughly 64% probability of a Fed rate hike by September, according to trading data reviewed as of this week, which means further yield increases remain a real possibility rather than a settled outcome.
Readers considering how this affects a specific portfolio should treat this as general context, not investment guidance, and consult a licensed financial advisor for decisions tied to individual holdings.
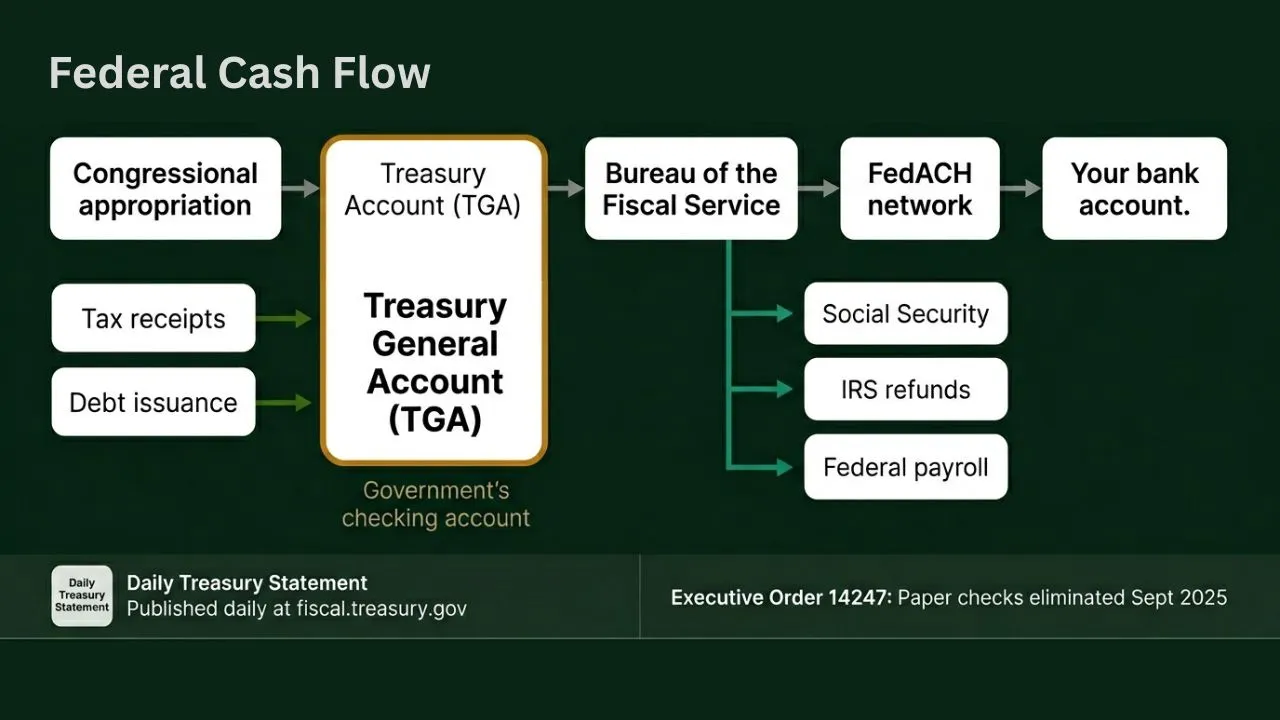
The relationship also runs through federal payments more broadly. Because treasury general account balances and Treasury issuance schedules interact with yield levels, higher yields can also affect how much the federal government pays to service its own debt, a dynamic worth watching given the size of the current us debt ceiling obligations already on the books.
What savers and borrowers should actually watch
For savers, this environment has been genuinely favorable. Money market funds and short-term Treasury bills are currently yielding levels not seen in years, and record amounts of cash, over $7.95 trillion according to recent money market funds record figures, have moved into these instruments precisely because they now offer meaningfully positive real returns.
For borrowers, particularly anyone shopping for a mortgage or considering refinancing, the current yield level makes locking in a rate sooner rather than later a reasonable consideration, since further Fed hawkishness could push rates higher before it pushes them lower.
Anyone with a diversified portfolio should understand that rising yields are a headwind for long-duration assets generally, whether bonds or growth-oriented equities, rather than assume any single asset class is immune.
Watch the July 28–29 FOMC meeting and subsequent inflation data closely, since both will likely move the 10-year yield meaningfully in one direction or the other. This is informational content, not a recommendation to buy, sell, or hold any specific security.
Methodology: This article combines U.S. Department of the Treasury daily yield data, Federal Reserve policy statements, and Bureau of Labor Statistics inflation data, independently reviewed as of publication.