
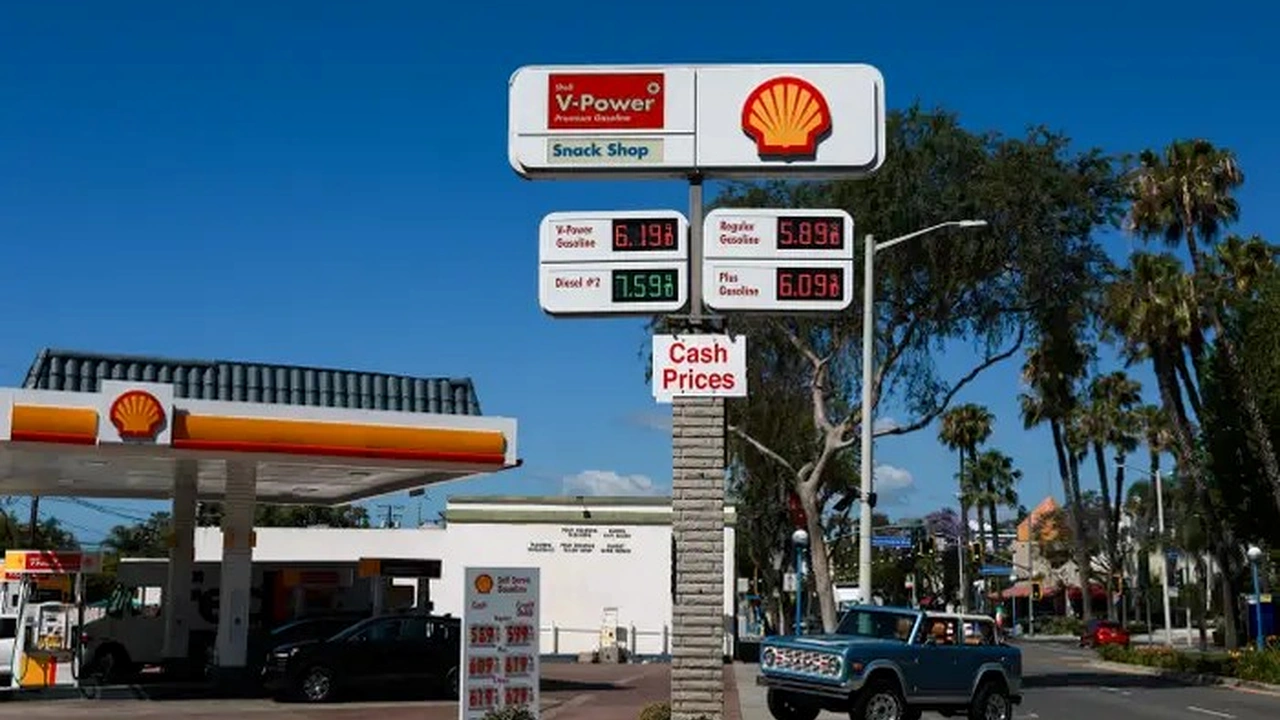
American drivers are getting some relief at the gas pump, but gasoline still costs substantially more than it did a year ago. The national average for regular gasoline fell to $4.153 per gallon on November 2, down 11.6 cents in one week, according to the U.S. Energy Information Administration (EIA). Yet the same federal data show that gasoline remains $1.134 per gallon, or approximately 37.6%, above its level in the comparable week of November 2025.
The difference is significant for motorists who are comparing today’s lower prices with what they paid last year. At the national averages, a 15-gallon fill-up costs approximately $17.01 more than a year earlier, even after becoming $1.74 cheaper over the latest week. Those figures are illustrative calculations from the EIA gasoline data, rather than estimates of what every driver actually spends.
The latest figures extend a decline from the September price peak and provide a clearer picture of how much of the earlier increase has been reversed. Gasoline has fallen for six consecutive weekly observations since September 21, when the national average reached $4.478 per gallon. That leaves regular gasoline 32.5 cents below its late-September level, but the improvement has not returned prices to where they stood before this year’s sharp increase.
A Smaller Gas Bill
The strongest evidence of the remaining price pressure comes from comparing identical gasoline categories across equivalent periods. EIA’s historical price series places regular gasoline at $3.019 per gallon on November 3, 2025, compared with $4.153 on November 2, 2026. Subtracting the two gives a $1.134 annual increase, while dividing that difference by the 2025 price produces a 37.6% rise.
The more recent decline is substantial in its own right. Prices have fallen from $4.269 on October 26 to $4.153 on November 2, a weekly reduction of 2.7%. The broader trend is consistent with the easing from elevated October levels, although the latest EIA observation differs in timing and methodology from the daily fuel-price measurements used in the October price comparison.
The starting point also changes how the latest movement looks. The national average reached $4.500 per gallon on May 11, 2026, before falling through part of the summer and climbing again during September. At $4.153, gasoline is now 34.7 cents below that May level, yet still considerably above the $2.867 recorded on February 2.
This means a driver can accurately observe that fuel has become cheaper recently while also recognizing that it remains more expensive than last autumn. Neither comparison cancels out the other, because the observations measure different periods. The relevant question for a household is not simply whether the national average declined, but how today’s local price compares with its previous fuel expenses and how much gasoline the household actually purchases.
Uneven Regional Relief
The national decline is not being experienced equally across the country. EIA’s November 2 data show that prices ranged from $3.636 across the Gulf Coast region to $5.296 on the West Coast, with substantially different weekly and annual changes. Even where prices declined, many regions continued to show increases exceeding a dollar per gallon from a year earlier.
The national decline is not being experienced equally across the country. EIA’s November 2 data show that prices ranged from $3.636 across the Gulf Coast region to $5.296 on the West Coast, with substantially different weekly and annual changes. Even where prices declined, many regions continued to show increases exceeding a dollar per gallon from a year earlier.
Across the United States, regular gasoline averaged $4.153 per gallon on November 2, down 11.6 cents from the previous week but $1.134 higher than a year earlier. California recorded an average of $5.748 per gallon, down 14.0 cents for the week but $1.314 above its year-earlier level. In Texas, gasoline averaged $3.578 per gallon, reflecting a weekly decline of 5.4 cents and a year-over-year increase of $1.112.
The Midwest recorded an average of $4.102 per gallon, down 16.7 cents from the previous week but $1.274 higher than a year earlier. Along the Gulf Coast, gasoline averaged $3.636 per gallon, representing a weekly decline of 6.6 cents and a year-over-year increase of $1.125.
California provides a particularly clear example of why national averages cannot describe every driver’s experience. At $5.748 per gallon, its November 2 average was $2.170 higher than Texas’s $3.578, a difference equivalent to $32.55 on a hypothetical 15-gallon purchase. California’s price had fallen 14 cents during the week but was still $1.314 higher than the comparable 2025 observation, according to EIA’s California price history.
Texas illustrates the other side of the comparison. Its regular-gasoline average was below $3.60, but the price was still $1.112 above its November 3, 2025, level of $2.466. The state’s historical gasoline data show that lower absolute prices do not necessarily mean drivers have avoided substantial year-over-year increases.
The weekly change was also uneven. The Rocky Mountain region recorded a decline of 24.5 cents per gallon, compared with just 1.9 cents in the Central Atlantic region, using EIA’s November 2 observations. Differences in fuel specifications, refinery access, distribution costs, taxes and local competition can affect regional prices, although the latest data alone cannot establish which factor explains each region’s weekly movement.
Behind the Decline
Understanding why gasoline remains expensive requires looking beyond the price of crude oil alone. EIA identifies four broad components of retail gasoline prices: crude oil, refining costs and profits, distribution and marketing, and taxes. Each can change independently, so a decline in crude oil does not automatically produce an equally large or immediate reduction at every station.
In its September energy analysis, the agency identified elevated crude prices and refining margins as important contributors to higher pump prices. Its October Short-Term Energy Outlook also attributed September’s increase in gasoline prices to crude oil and rising crack spreads, the differences between petroleum product prices and crude costs. Those findings help explain the earlier increase, but they do not establish precisely how much of November’s decline came from either component.
The distinction matters because wholesale and retail gasoline are measured at different stages of the fuel market. September’s wholesale gasoline surge demonstrated how energy costs could rise before the full effect was visible in household spending measures. Refinery margins, inventories, transportation conditions and retail competition can influence how quickly subsequent cost reductions appear at the pump.
Recent uncertainty surrounding Middle Eastern oil supplies adds another complication. The risks examined in reports on Hormuz tanker disruptions remain relevant to understanding why energy markets can change direction quickly. However, a documented supply disruption and a subsequent change in gasoline prices do not, by themselves, establish a precise causal relationship.
The same caution applies when oil markets move sharply downward. The November oil selloff and the subsequent Brent price rebound illustrate the volatility surrounding expectations for future supply. Changes in futures prices can influence wholesale fuel costs, but neither market movement guarantees that American motorists will see a corresponding price change immediately.
There is another reason to avoid treating oil prices as a simple forecast of gasoline costs. Federal Reserve research discussed in an oil futures analysis examines how risk premiums and difficult market conditions can distort the information contained in futures quotations. The research reinforces the distinction between observed market prices, expectations about future conditions and the actual cost of gasoline sold to consumers.
Seasonal conditions can also contribute to lower pump prices. EIA explains that gasoline demand generally rises during the summer and that required fuel formulations, refining expenses and regional market conditions can influence seasonal pricing. The autumn decline is therefore consistent with several possible mechanisms, including seasonal changes, but the November 2 retail survey cannot isolate their individual effects.
Taxes further complicate comparisons between states. The EIA gasoline breakdown identifies a federal gasoline tax of 18.4 cents per gallon, alongside state and local levies that vary geographically. That federal amount represents only about 16.2% of the current $1.134 national year-over-year price difference, illustrating why proposals examined in the gas tax debate would address only one component of pump prices.
What Drivers Feel
The financial consequences depend heavily on the amount of gasoline purchased. A motorist buying 15 gallons at the November 2 national average would pay approximately $62.30, compared with $45.29 using the November 2025 price. A driver buying 30 gallons would face a year-over-year difference of $34.02, assuming the same national-average prices.
These calculations measure the price difference on hypothetical purchases, not the actual increase in a household’s annual gasoline bill. Vehicle efficiency, travel distance, geographic location, changes in driving behavior and the prices paid on different dates all influence real expenses. Extending the latest $1.134 gap across an entire year without accounting for changing prices and fuel purchases would produce an unreliable household-cost estimate.
Gasoline also matters beyond the amount displayed on an individual receipt. Energy prices contribute to consumer inflation, while transportation is one of the categories influencing broader household expenses. The July inflation report illustrated how lower gasoline prices and higher shelter costs could move in different directions within the same monthly inflation release.
But weekly gasoline averages should not be confused with the official monthly Consumer Price Index. The Bureau of Labor Statistics uses its own motor fuel methodology, based on a different data collection and index-construction process. Its monthly figures and EIA’s weekly observations can differ because their timing and measurement methods are not identical, a distinction explained further in the CPI measurement guide.
The result is that lower weekly pump prices can provide genuine near-term relief without demonstrating that overall inflation has slowed by the same amount. The effect on the wider economy depends on the duration of energy-price changes and how they interact with other expenses. Gasoline is important to households, but it represents only one part of the broader consumer price picture.
The Next Test
The latest price decline is encouraging for motorists, but its durability remains uncertain. Lower crude oil costs, more favorable refining conditions or continued seasonal easing could support further reductions, while renewed supply disruptions or higher wholesale prices could work in the opposite direction. The current survey does not establish which outcome will dominate.
The next scheduled EIA weekly gasoline-price release is November 10, 2026, covering the November 9 observation. That reading will show whether the decline continued, while regional figures will help determine whether reductions are spreading more evenly across the country. EIA’s next Short-Term Energy Outlook is also scheduled for November 10, providing an updated assessment of petroleum market conditions and forecasts.
For now, the evidence supports two conclusions that need to be understood together. Regular gasoline has become noticeably cheaper since late September, offering meaningful relief on individual purchases, yet its national average remains approximately 38% higher than a year ago. The next measure of improvement will be whether prices continue falling long enough, and broadly enough, to narrow that annual gap rather than simply retreat from a recent peak.