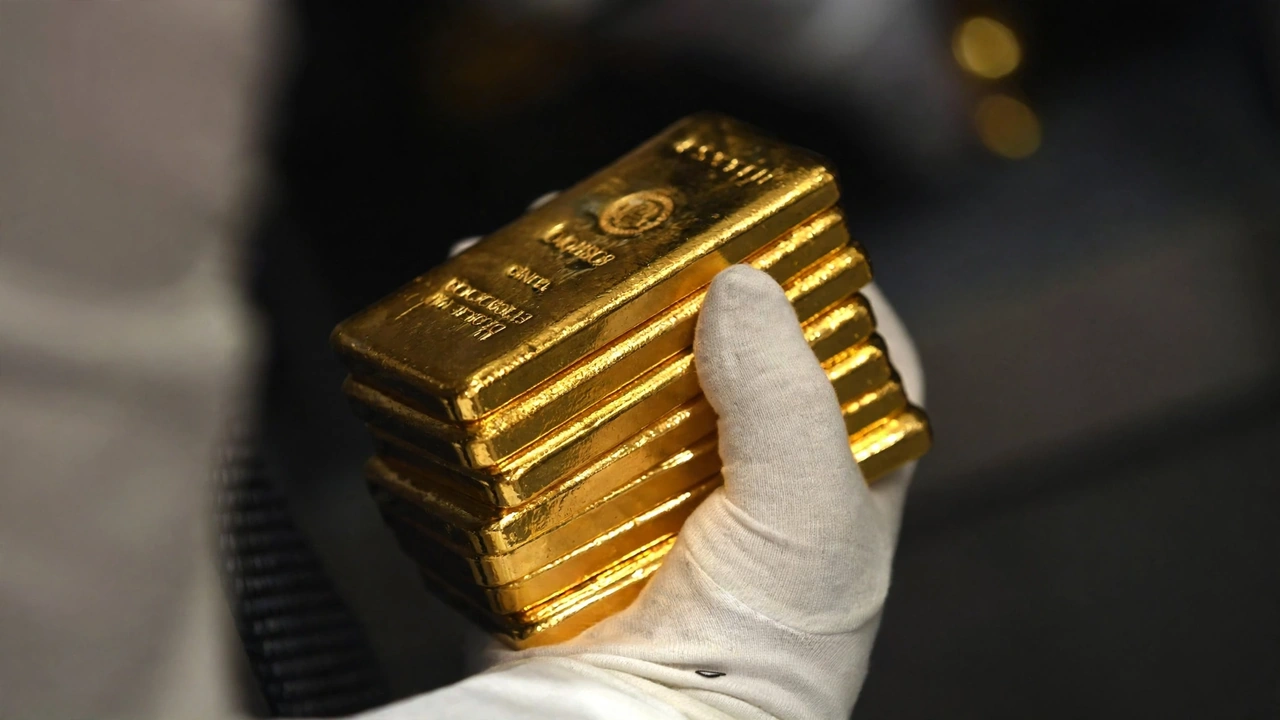

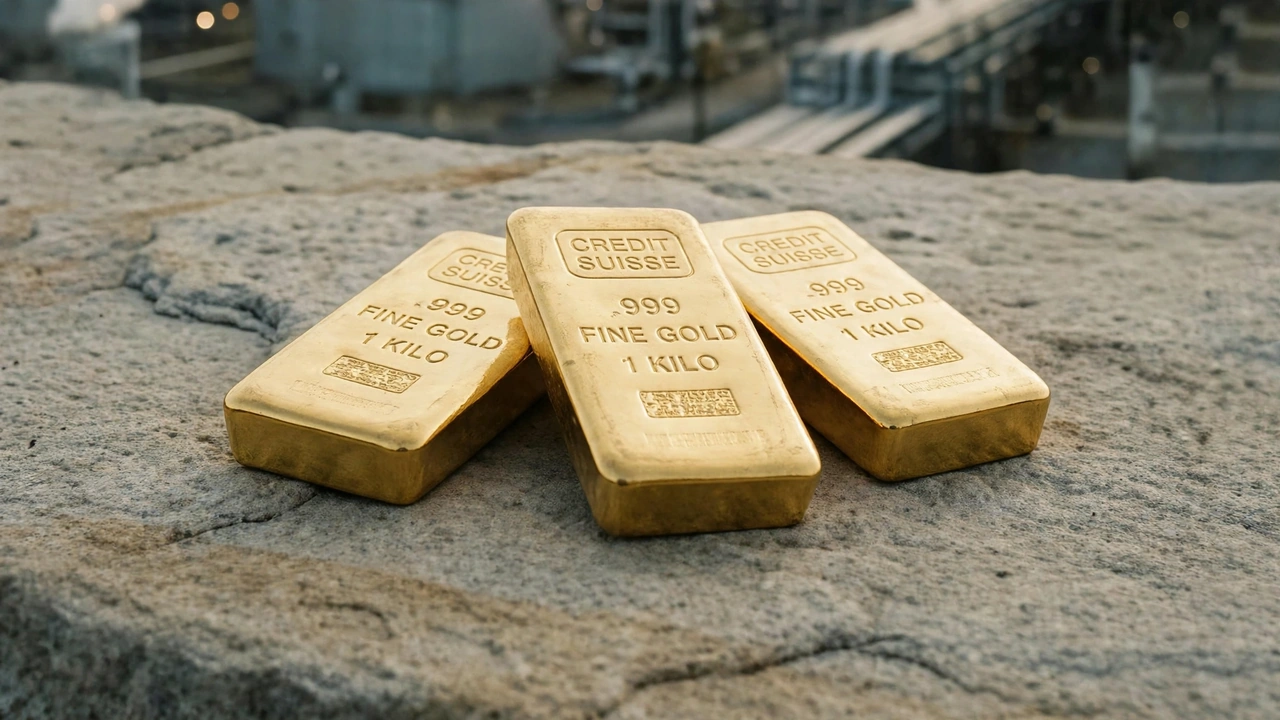
Gold prices slipped on Tuesday, November 10, 2026, as investors prepared for a major U.S. inflation report that could reshape expectations for Federal Reserve interest rates. Spot gold fell 0.4% to $4,124.42 per troy ounce at 6:18 a.m. GMT, according to a timestamped Reuters market quotation, reversing part of Monday’s rally. U.S. gold futures for December delivery moved in the opposite direction, gaining 0.5% to $4,133 an ounce at the reported observation.
The divergence highlights the importance of distinguishing immediate spot-market movements from prices for contracts delivering metal at a future date. The pullback followed a strong recovery that had lifted gold more than 5% during the preceding week, bringing investors to Tuesday’s inflation announcement with substantial recent gains still in place.
The Bureau of Labor Statistics scheduled October’s Consumer Price Index for 8:30 a.m. Eastern Time, making inflation the next major test for gold and interest-rate expectations. Stronger inflation could reinforce concerns about additional monetary tightening, while weaker readings might ease pressure on non-yielding assets. Neither outcome guarantees a particular gold-price reaction.
Gold’s Rebound Faces Pressure
Tuesday’s decline interrupted a recovery that had regained momentum after several volatile sessions. Spot gold had risen more than 1% on Monday, following a week in which bullion advanced approximately 5.2%, according to Reuters. The weekly gold rally had already brought attention to the approaching inflation report, but Tuesday’s selling introduced a fresh market development before the data arrived. Profit-taking was one explanation offered by market analysts, although a single cause cannot be established from price movements alone.
The latest pullback also looks different when compared with Friday’s trading. On November 6, spot gold was quoted at $4,074.36 per ounce at 1:54 p.m. Eastern Time, after recovering from an intraday low of $4,033.29, according to Reuters. Comparing that Friday observation with Tuesday’s $4,124.42 quotation produces a $50.06 increase per ounce, approximately 1.23%, even after Tuesday’s decline.
These are two timestamped spot quotations rather than synchronized daily settlements, so the calculation measures their difference without establishing a complete trading-period return. That distinction matters because investors can encounter sharply different gold-price headlines within days, even when the broader market recovery remains partly intact.
The Friday gold decline showed how employment figures and interest-rate expectations could interrupt buying momentum. Earlier in the week, gold above $4,100 had reflected renewed strength after an unstable October. Tuesday’s reversal illustrates the market’s continuing sensitivity to economic developments rather than confirming a lasting change in direction.
Inflation Takes Center Stage
The latest available September inflation report showed the Consumer Price Index rising 0.6% on a seasonally adjusted monthly basis and 3.7% over the preceding 12 months. Core CPI, which excludes food and energy, increased 0.3% during September and 2.6% from a year earlier. Gasoline prices rose 9.1% during the month, contributing more than half of the overall monthly increase. Those figures establish the inflation background before October’s results, not what Tuesday’s new report will show.
Investors will examine whether price increases have broadened beyond energy and whether underlying inflation remains persistent. A slower headline CPI increase accompanied by stubborn core inflation could produce a different market response from a broad-based moderation in prices.
The inflation measurement framework helps explain why individual categories, seasonal adjustments and comparisons with earlier periods matter. The relevant market question is not simply whether inflation rises or falls, but how the result changes expectations already reflected in asset prices.
The Federal Reserve maintained its federal funds target range at 3.75%–4.00% on October 28, according to its official policy statement. Two officials dissented in favor of increasing rates by a quarter percentage point, demonstrating disagreement over the appropriate response to persistent inflation. The October rate decision established that policymakers were not unanimous, but it did not determine their next action. Tuesday’s CPI data will provide additional evidence for the December meeting without making another rate increase inevitable.
The labor market adds another dimension to that decision. The government’s October jobs report, published November 6, showed nonfarm payrolls increasing by 165,000 and unemployment standing at 4.1%. Those figures indicated continued employment growth, giving policymakers further evidence to weigh alongside elevated inflation. The latest employment figures help explain why the interaction between economic resilience and price pressures has become central to the interest-rate debate.
Treasury Yields Add Pressure
Official Treasury records reveal a meaningful change in bond-market pricing immediately before Tuesday’s gold decline. The two-year Treasury par yield increased from 4.51% on November 6 to 4.56% on November 9, while the 10-year yield rose from 4.86% to 4.88%. Based on the Treasury yield records, those movements represent increases of five and two basis points, respectively. The difference between the two maturities consequently narrowed from 35 to 32 basis points, an original calculation from the government’s daily observations.
That comparison matters because shorter-term yields increased more rapidly than longer-term yields during the latest completed trading session. Higher yields can make interest-bearing investments more attractive relative to bullion, which produces no interest income.
The broader relationship between Treasury yields and gold remains important, but these daily observations do not prove that bond-market movements caused Tuesday’s specific decline. The Treasury figures are end-of-day reference observations, not transactions synchronized with the gold quotations.
Geopolitical developments remain another potential influence on precious metals. Oil prices had weakened as investors reassessed diplomatic developments involving Iran, with Brent crude falling during Monday’s session. Changes in energy prices can alter inflation expectations, while political uncertainty can affect demand for assets perceived as defensive holdings. These channels may interact with the dollar and bond yields, but their individual contributions to Tuesday’s gold price cannot be isolated from the available observations.
What Gold Buyers Face
For investors holding physical bullion, the practical consequence of a market movement depends on how much metal they own and the price available when they transact. At Tuesday’s reported spot quotation of $4,124.42, five troy ounces would have an indicative underlying metal value of $20,622.10, before dealer spreads, taxes and other charges. A subsequent $100-per-ounce movement would change that indicative value by $500 for the same five-ounce holding. These are arithmetic illustrations of price exposure, not forecasts or guaranteed resale proceeds.
Retail prices can differ significantly from wholesale spot quotations. The U.S. Mint’s bullion coin guidance explains that its bullion coins are distributed through authorized purchasers and sold with premiums that cover minting, distribution and marketing. Investors purchasing coins or bars therefore need to distinguish the underlying metal price from the final dealer price and any selling discount. A $50 decline in international spot gold does not automatically mean a retail buyer will save exactly $50 on a one-ounce product.
Futures traders face a different calculation because contracts can involve substantially larger exposures and leverage. A standard 100-troy-ounce gold futures position would experience a $10,000 change in its underlying contract value from a $100-per-ounce price movement, before transaction costs.
The Commodity Futures Trading Commission’s gold investment warning explains that leverage can magnify losses and create significant financial risks. Gold-backed funds, mining shares and physical bullion also have different costs and exposure characteristics, making their returns unsuitable for direct comparison without further adjustments.
The Next Gold Price Test
The immediate market event is the October CPI release, scheduled for Tuesday, November 10, at 8:30 a.m. Eastern Time under the government’s CPI release calendar. The October Producer Price Index is scheduled for Friday, November 13, followed by the Federal Reserve’s December 8–9 policy meeting, according to its meeting calendar. Each event offers additional information about inflation and monetary policy, but none establishes how gold will trade afterward.
Investors should distinguish the actual published figures from forecasts and expectations formed before their release. Gold’s decline to $4,124.42 leaves a clear question: whether the market’s recent recovery can withstand fresh inflation evidence and shifting interest-rate expectations.
The metal remained above its quoted Friday afternoon level despite Tuesday’s retreat, while Treasury yields showed continued pressure at shorter maturities. The CPI release could alter that balance, but its effect will depend on the actual data and how financial markets respond. Until then, the verified picture is a strong preceding rally, a partial reversal and an important inflation announcement still ahead.