


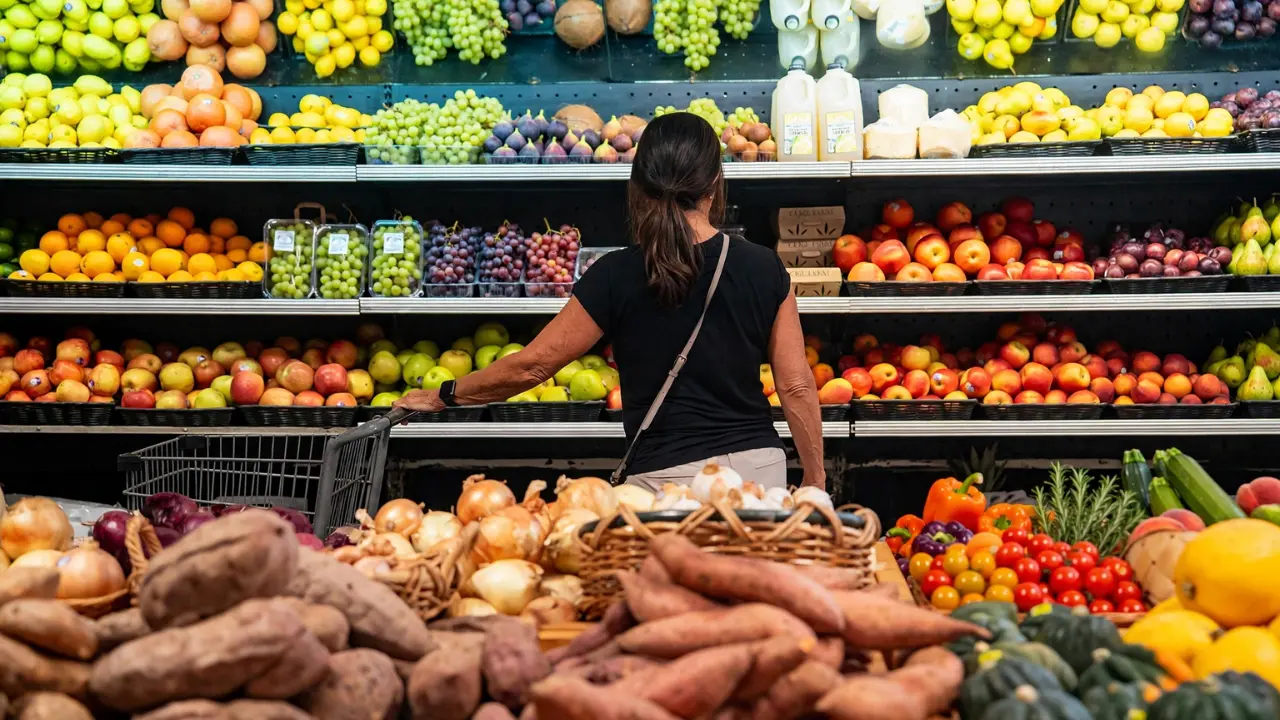
U.S. inflation eased to 3.4% in July as gasoline prices fell during the month, helping offset continued increases in shelter and several service categories. But gasoline was still nearly 25% more expensive than a year earlier, showing why the latest inflation report carries two very different messages depending on the time period being measured.
The Consumer Price Index rose 0.1% in July on a seasonally adjusted basis, after falling 0.4% in June, according to the Bureau of Labor Statistics’ official July 2026 CPI release. Over the previous 12 months, headline inflation slowed to 3.4% from 3.5% in June. Core CPI, which excludes food and energy, increased 0.2% in July after being unchanged in June. The annual core inflation rate eased to 2.5% from 2.6%.
The headline numbers establish how inflation changed. The more revealing question is why July inflation moved the way it did. Falling gasoline prices pulled the monthly index lower, shelter remained an important source of upward pressure, grocery prices edged down, restaurant prices increased, and several core services moved in opposite directions.
Investozora’s separate analysis of the July 2026 CPI rate, core inflation and Federal Reserve implications covers the overall report and monetary-policy picture in depth. This report focuses specifically on the prices that drove July’s change.
Why did inflation slow in July 2026?
Annual headline inflation slowed because consumer prices were 3.4% higher than in July 2025, compared with the 3.5% 12-month increase recorded in June. On a monthly basis, however, the overall CPI still increased 0.1%.
That distinction matters. A lower inflation rate does not mean the overall price level fell. It means prices were rising more slowly when measured against the comparable period a year earlier.
Within July itself, one of the strongest downward forces came from energy. The energy index fell 1.5%, following a much larger 5.7% decline in June. Gasoline prices fell 2.9% on a seasonally adjusted basis.
Shelter moved in the opposite direction. The shelter index increased 0.1% and, according to BLS, accounted for roughly two-thirds of the monthly increase in the overall CPI. The result was a relatively small 0.1% monthly rise even though important parts of household spending continued becoming more expensive.
For readers who want to understand why a few categories can have an outsized effect on the headline figure, Investozora’s guide to how BLS measures the Consumer Price Index explains how expenditure weights determine each category’s influence on CPI.
Gas prices fell in July, but were still 24.6% higher than a year earlier
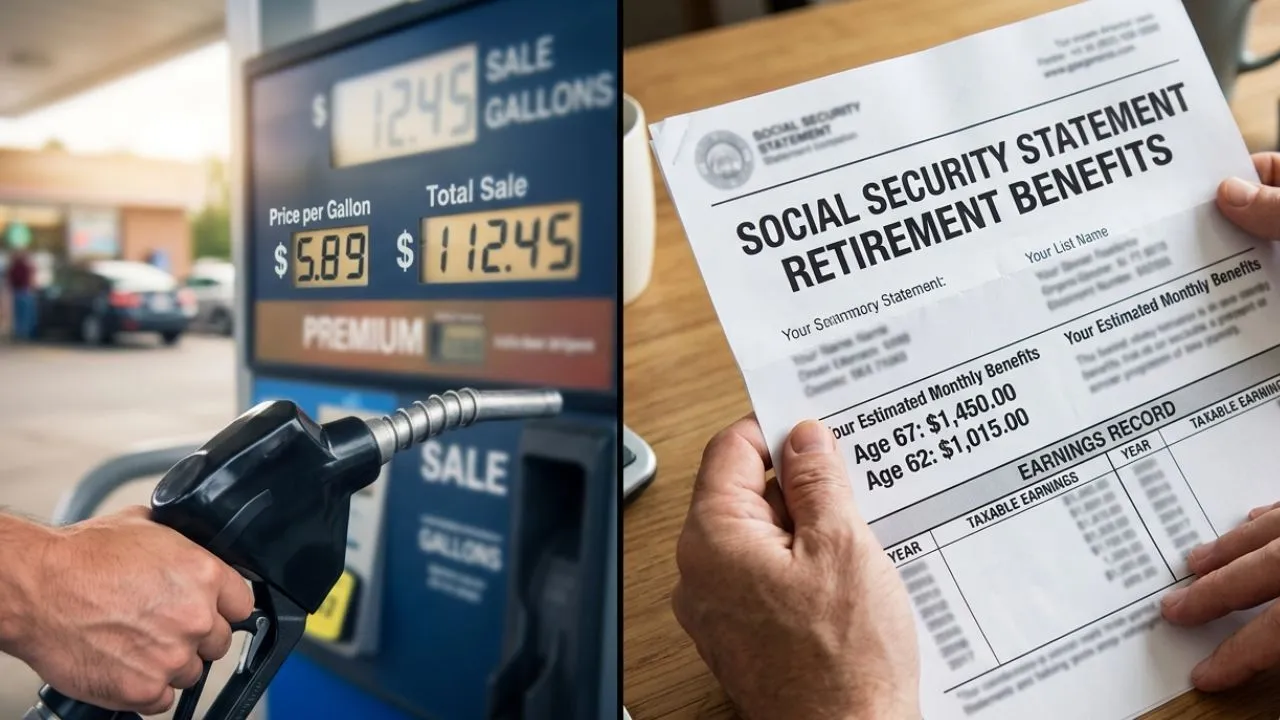
Gasoline provides perhaps the clearest example of why monthly and annual inflation can tell very different stories. BLS reported that gasoline prices fell 2.9% from June to July after seasonal adjustment. Before seasonal adjustment, gasoline prices declined 2.1% during the month.
But compared with July 2025, the gasoline index was still 24.6% higher. That means gasoline helped hold down the July monthly CPI reading even though drivers were still facing substantially higher gasoline prices than they had one year earlier.
The same pattern appears across the broader energy category. Energy prices fell 1.5% during July, yet the energy index remained 14.7% above its level a year earlier. Electricity moved up 0.1% during July and was 4.2% higher over 12 months. Utility piped gas service increased 0.7% for the month and 4.3% over the year.
So the answer to “Did gas prices lower July inflation?” is yes on a month-to-month basis. The answer to “Were gas prices lower than a year ago?” is no. That distinction is central to understanding the July report.
Which prices fell in July 2026?
Gasoline was not the only category providing some relief. Prices for food at home fell 0.1% during July. Within grocery categories, the index for meats, poultry, fish and eggs declined 0.7%, while pork fell 1.5%. Fruits and vegetables declined 0.1%, including a 16.4% drop in lettuce prices.
Some other household expenses also moved lower. Prescription drug prices declined 0.8%, and motor vehicle insurance fell 0.3% after dropping 2.0% in June. Lodging away from home, which includes hotel and motel accommodation within the shelter index, fell 2.8% during July.
Those declines did not mean consumer costs were falling broadly. Other categories were increasing at the same time, and some of those categories carry substantial weight in household budgets. Food overall, for example, still increased 0.1% because cheaper grocery prices were offset by higher prices for meals away from home.
Grocery prices fell while restaurant prices kept rising
The July food data show another split beneath the headline number. The food-at-home index declined 0.1%, but the food-away-from-home index increased 0.3%. Limited-service meals increased 0.4%, while full-service meals rose 0.2%.
Over the previous 12 months, grocery prices were 2.7% higher, while food away from home was 3.4% higher. Not every grocery category became cheaper in July. Nonalcoholic beverages increased 0.9%, and cereals and bakery products rose 0.2%.
That means households buying groceries experienced a different July price pattern from households spending more heavily at restaurants and other food-service businesses.
Shelter costs rose even as hotel prices fell
Shelter remained one of the most important upward contributors to July CPI. The overall shelter index increased 0.1% for the month and 3.2% over the previous year. BLS said shelter accounted for roughly two-thirds of July’s monthly increase in the all-items CPI.
But shelter itself was not moving uniformly. Rent of primary residence increased 0.3%, while owners’ equivalent rent also rose 0.3%. Owners’ equivalent rent is the CPI measure designed to estimate the rental value of owner-occupied housing.
At the same time, lodging away from home fell 2.8%. That combination helps explain why simply saying “housing prices rose” misses part of the July story. Longer-term residential shelter measures continued moving higher, while temporary accommodation prices moved sharply lower.
Core CPI rose 0.2% as airfares and medical care increased
Removing food and energy from the calculation shows that underlying price pressure did not disappear. Core CPI increased 0.2% in July, after being unchanged in June, although its annual rate eased from 2.6% to 2.5%.
Medical care increased 0.4% during the month. Hospital services rose 0.5%, while physicians’ services increased 0.2%. Prescription drugs, however, moved in the opposite direction with a 0.8% decline.
Airline fares rose 2.2% in July after increasing just 0.2% in June. Communication prices increased 0.6%, education rose 0.5%, recreation increased 0.2%, and used cars and trucks rose 0.4%.
The mixture matters because a low headline CPI number caused partly by falling energy prices does not necessarily mean price pressure has disappeared elsewhere in the economy. July instead showed a combination of falling energy prices, slower annual inflation and continued increases across several core service categories.
What the July inflation report means for the Federal Reserve
The July CPI report gives the Federal Reserve additional evidence that annual headline and core inflation have moderated from June, but it does not determine the central bank’s September decision.
At its July 28–29 meeting, the Federal Open Market Committee kept the federal funds target range at 3.50% to 3.75%, according to the Fed’s official July FOMC statement. The decision passed 9–3, with Beth Hammack, Neel Kashkari and Lorie Logan preferring a quarter-percentage-point increase. The Committee also said inflation remained elevated relative to its 2% goal.
There is an important technical distinction here: the Federal Reserve’s formal 2% inflation objective is not based on CPI. The FOMC defines its longer-run goal using the annual change in the Personal Consumption Expenditures price index, as confirmed in its 2026 Statement on Longer-Run Goals and Monetary Policy Strategy. Investozora explains the difference in its guide to the Federal Reserve’s 2% inflation target.
CPI still matters because it provides an early and detailed reading of consumer-price pressure. But July’s CPI numbers should be treated as new evidence available to policymakers, not as a mechanical signal that tells the Fed whether to raise, hold or lower interest rates.
What happens after the July CPI report?
The next major comparison will come with the August 2026 CPI report, which BLS has scheduled for Friday, September 11 at 8:30 a.m. ET. That release comes only days before the Federal Reserve’s September 15–16 FOMC meeting, according to the Fed’s official meeting calendar.
Investozora’s 2026 FOMC meeting schedule provides the broader calendar for the remaining policy decisions. The question going into September is therefore not simply whether July inflation was “good” or “bad.” The more useful question is whether the pattern continues.
July showed annual inflation easing to 3.4%, gasoline falling 2.9% during the month and grocery prices edging lower. At the same time, shelter costs continued to rise, core prices increased 0.2%, and gasoline remained 24.6% more expensive than a year earlier.
Those opposing movements are the central story of the July CPI report—and the reason one headline inflation number cannot describe everything consumers are experiencing.









One thought on “BLS: U.S. Inflation Slows to 3.4% in July as Gas Prices Fall and Shelter Costs Rise @import url("https://fonts.googleapis.com/css2?family=Poppins:wght@400;500;600&family=Source+Sans+3:wght@400;500;600;700&display=swap"); /* ========================================= NORMAL BYLINE ========================================= */ .izo-clean-byline { display: flex; align-items: center; justify-content: space-between; width: 100%; max-width: 620px; gap: 16px; margin-top: 4px; margin-bottom: 16px; font-family: "Poppins", Arial, sans-serif; } .izo-clean-byline-content { display: flex; flex-direction: column; justify-content: center; align-items: flex-start; min-width: 0; gap: 4px; line-height: 1.12; transform: translateY(-4px); font-family: "Poppins", Arial, sans-serif; } .izo-clean-author-wrap { position: relative; display: inline-block; width: fit-content; line-height: 1.12; margin: 0; padding: 0; outline: none; } .izo-by-label { font-family: "Poppins", Arial, sans-serif; font-size: 14px; font-weight: 400; color: #111; line-height: 1.12; margin-right: 3px; } .izo-clean-author-name { position: relative; display: inline-block; font-family: "Poppins", Arial, sans-serif; font-size: 14px; font-weight: 600; color: #111; cursor: pointer; line-height: 1.12; padding: 0; margin: 0; text-decoration-line: underline; text-decoration-color: #111; text-decoration-thickness: 1px; text-underline-offset: 1px; } .izo-clean-author-name::after { display: none; } .izo-clean-meta { font-family: "Poppins", Arial, sans-serif; font-size: 11px; font-weight: 400; color: #555; line-height: 1.12; margin: 0; padding: 0; } /* ========================================= RIGHT ACTIONS GOOGLE + SHARE ========================================= */ .izo-byline-actions { display: flex; align-items: center; justify-content: flex-end; gap: 7px; flex: 0 0 auto; position: relative; top: 6px; } /* ========================================= GOOGLE SOURCE BADGE ========================================= */ .izo-google-source-badge { display: inline-flex; align-items: center; justify-content: center; width: 34px; height: 34px; min-width: 34px; flex: 0 0 34px; padding: 6px; margin: 0; box-sizing: border-box; background: #ffffff !important; border: 1px solid rgba(85,85,85,0.30) !important; border-radius: 6px; box-shadow: none !important; text-decoration: none !important; overflow: hidden; transition: border-color 0.18s ease, background-color 0.18s ease; } .izo-google-source-badge img { display: block; width: 100%; height: 100%; max-width: 100%; object-fit: contain; object-position: center; margin: 0; padding: 0; border: 0 !important; border-radius: 0 !important; background: transparent !important; box-shadow: none !important; } .izo-google-source-badge:hover { background: #ffffff !important; border-color: rgba(85,85,85,0.45) !important; box-shadow: none !important; transform: none !important; } .izo-google-source-badge:focus { background: #ffffff !important; outline: 1px solid rgba(85,85,85,0.45); outline-offset: 2px; box-shadow: none !important; } /* ========================================= SHARE BUTTON ========================================= */ .izo-share-button { display: inline-flex; align-items: center; justify-content: center; width: 34px; height: 34px; min-width: 34px; flex: 0 0 34px; padding: 7px; margin: 0; box-sizing: border-box; background: #ffffff !important; border: 1px solid rgba(85,85,85,0.30) !important; border-radius: 6px; box-shadow: none !important; color: #333333 !important; cursor: pointer; text-decoration: none !important; overflow: hidden; appearance: none; -webkit-appearance: none; transition: border-color 0.18s ease, color 0.18s ease, background-color 0.18s ease; } .izo-share-button svg { display: block; width: 18px; height: 18px; fill: none; stroke: currentColor; stroke-width: 1.8; stroke-linecap: round; stroke-linejoin: round; margin: 0; padding: 0; } .izo-share-button:hover { background: #ffffff !important; border-color: rgba(85,85,85,0.45) !important; color: #111111 !important; box-shadow: none !important; transform: none !important; } .izo-share-button:focus { background: #ffffff !important; outline: 1px solid rgba(85,85,85,0.45); outline-offset: 2px; box-shadow: none !important; } /* ========================================= AUTHOR DETAILS CARD ========================================= */ .izo-clean-author-tooltip { position: absolute; top: calc(100% + 10px); left: 0; width: 440px; max-width: calc(100vw - 40px); background: #fff; color: #333; border: 1px solid #e5e5e5; border-radius: 8px; padding: 16px; font-family: "Source Sans 3", Arial, sans-serif; font-size: 13px; font-weight: 400 !important; line-height: 1.55; box-shadow: 0 8px 24px rgba(0,0,0,0.10); opacity: 0; visibility: hidden; transform: translateY(5px); transition: opacity 0.2s ease, transform 0.2s ease, visibility 0.2s ease; z-index: 9999; pointer-events: none; } /* ========================================= IMAGE + BIO ========================================= */ .izo-tooltip-main { display: flex; align-items: flex-start; gap: 14px; width: 100%; } .izo-tooltip-image { width: 96px; height: 96px; flex: 0 0 96px; object-fit: cover; object-position: center; display: block; border-radius: 6px; margin: 0; padding: 0; } .izo-tooltip-bio { flex: 1 1 auto; min-width: 0; font-family: "Source Sans 3", Arial, sans-serif; font-size: 13px; font-weight: 400; line-height: 1.55; color: #333; margin: 0; padding: 0; } .izo-clean-author-tooltip strong { font-family: "Source Sans 3", Arial, sans-serif; font-weight: 400 !important; } /* ========================================= DESKTOP HOVER ========================================= */ .izo-clean-author-wrap:hover .izo-clean-author-tooltip { opacity: 1; visibility: visible; transform: translateY(0); pointer-events: auto; } /* ========================================= KEYBOARD / MOBILE TAP ========================================= */ .izo-clean-author-wrap:focus .izo-clean-author-tooltip, .izo-clean-author-wrap:focus-within .izo-clean-author-tooltip { opacity: 1; visibility: visible; transform: translateY(0); pointer-events: auto; } /* ========================================= POPUP FOOTER SOCIALS | READ PROFILE ========================================= */ .izo-tooltip-footer { display: flex; align-items: center; gap: 14px; margin-top: 16px; width: 100%; } .izo-tooltip-socials { display: flex; align-items: center; gap: 14px; margin: 0; padding: 0; } .izo-tooltip-socials a { display: inline-flex; align-items: center; justify-content: center; width: 24px; height: 24px; color: #222; text-decoration: none; border: none; transition: opacity 0.2s ease, transform 0.2s ease; } .izo-tooltip-socials a:hover { opacity: 0.72; transform: translateY(-1px); } .izo-tooltip-socials svg { width: 21px; height: 21px; fill: currentColor; display: block; } /* Grey separator */ .izo-tooltip-separator { display: inline-flex; align-items: center; justify-content: center; color: #b5b5b5; font-family: "Source Sans 3", Arial, sans-serif; font-size: 20px; font-weight: 400; line-height: 1; margin: 0 1px; } /* Read profile */ .izo-clean-author-tooltip .izo-profile-link { display: inline-block; font-family: "Source Sans 3", Arial, sans-serif; font-size: 13px; font-weight: 600; color: #1a73e8; text-decoration: none; border-bottom: 1px solid #1a73e8; line-height: 1.25; white-space: nowrap; } /* ========================================= MOBILE ========================================= */ @media (max-width: 650px) { .izo-clean-byline { display: flex; flex-direction: row; align-items: center; justify-content: space-between; width: 100%; max-width: 100%; gap: 7px; margin-top: 3px; margin-bottom: 14px; flex-wrap: nowrap; } .izo-clean-byline-content { display: flex; flex-direction: column; flex: 1 1 auto; min-width: 0; max-width: calc(100% - 68px); gap: 3px; line-height: 1.12; transform: translateY(-4px); } .izo-clean-author-wrap { line-height: 1.12; margin: 0; padding: 0; max-width: 100%; white-space: nowrap; } .izo-by-label { font-size: 12px; line-height: 1.12; margin-right: 3px; } .izo-clean-author-name { font-size: 12px; font-weight: 600; line-height: 1.12; padding: 0; margin: 0; text-underline-offset: 1px; white-space: nowrap; } .izo-clean-meta { font-size: 9.5px; line-height: 1.12; margin: 0; padding: 0; color: #555; white-space: nowrap; } /* ========================================= GOOGLE + SHARE MOBILE STAY ON SAME ROW ========================================= */ .izo-byline-actions { display: flex; flex-direction: row; align-items: center; justify-content: flex-end; gap: 5px; flex: 0 0 auto; white-space: nowrap; position: relative; top: 5px; } /* GOOGLE MOBILE */ .izo-google-source-badge { width: 28px; height: 28px; min-width: 28px; flex: 0 0 28px; padding: 5px; border-radius: 5px; background: #ffffff !important; border: 1px solid rgba(85,85,85,0.30) !important; box-shadow: none !important; margin: 0; } .izo-google-source-badge img { width: 100%; height: 100%; } /* SHARE MOBILE */ .izo-share-button { width: 28px; height: 28px; min-width: 28px; flex: 0 0 28px; padding: 6px; border-radius: 5px; background: #ffffff !important; border: 1px solid rgba(85,85,85,0.30) !important; box-shadow: none !important; margin: 0; } .izo-share-button svg { width: 15px; height: 15px; stroke-width: 1.8; } /* ========================================= MOBILE AUTHOR CARD ========================================= */ .izo-clean-author-tooltip { width: min(340px, calc(100vw - 32px)); max-width: calc(100vw - 32px); padding: 14px; left: 0; font-size: 12.5px; line-height: 1.5; } .izo-tooltip-main { gap: 11px; align-items: flex-start; } .izo-tooltip-image { width: 82px; height: 82px; flex: 0 0 82px; border-radius: 5px; } .izo-tooltip-bio { font-size: 12.5px; line-height: 1.5; } /* Mobile footer */ .izo-tooltip-footer { gap: 11px; margin-top: 14px; flex-wrap: nowrap; } .izo-tooltip-socials { gap: 12px; } .izo-tooltip-socials a { width: 22px; height: 22px; } .izo-tooltip-socials svg { width: 20px; height: 20px; } .izo-tooltip-separator { font-size: 18px; margin: 0; } .izo-clean-author-tooltip .izo-profile-link { font-size: 12.5px; line-height: 1.2; } }
ByAdarsha Dhakal

Adarsha Dhakal is the Founder and Editor of Investozora, an independent U.S. financial news publication he launched in August 2025. He covers IRS tax refunds, Social Security benefit payments, federal payment systems, Federal Reserve policy, and U.S. Treasury operations, explaining how government financial decisions affect the daily lives of American households. All reporting is sourced directly from official government records including IRS.gov, SSA.gov, FederalReserve.gov, and fiscal.treasury.gov.
|
Read full profile →
Published Aug 12, 2026 · 3:46 PM ET · Updated 1 month ago

”