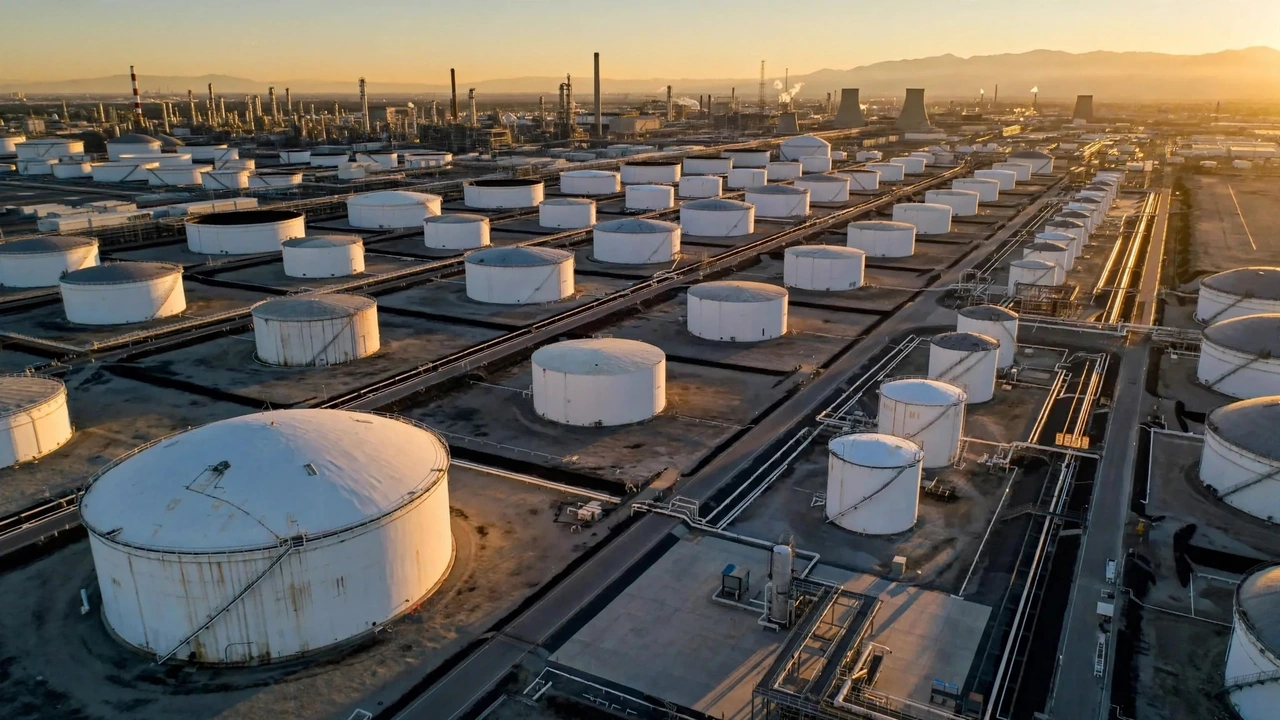


U.S. commercial crude oil inventories rose by 3.4 million barrels to 417.8 million barrels in the week ended November 13, 2026, while gasoline stockpiles increased by 5.2 million barrels to 215.9 million barrels, according to the Energy Information Administration’s (EIA) November 18 report. The increase marked a second consecutive weekly build in commercial crude stocks, following a 4.7 million-barrel rise the previous week.
Gasoline inventories recorded a substantially larger increase than the prior week’s 1.8 million barrels, adding to the latest evidence of rising U.S. petroleum supplies. Despite the increase, commercial crude inventories remained approximately 3% below their five-year seasonal average, while gasoline inventories stood 3% above their comparable benchmark.
The figures present a mixed supply picture: crude stocks remained relatively low by historical standards even as refined-fuel inventories expanded. The latest build also reversed the direction seen in an earlier crude inventory decline.
Gasoline Stocks Jump 5.2 Million Barrels
The EIA’s petroleum balance sheet showed gasoline inventories climbing from 210.8 million barrels to 215.9 million barrels. Distillate inventories, which include diesel and heating oil, increased by 1.6 million barrels to 104.9 million barrels, but remained 7% below their five-year seasonal average.
Total commercial petroleum inventories, excluding the Strategic Petroleum Reserve, increased by 9.2 million barrels to approximately 1.225 billion barrels. Gasoline’s four-week average product supplied was about 8.7 million barrels per day, down 1.8% from the comparable period a year earlier.
Total petroleum products supplied averaged 20.6 million barrels per day over four weeks, declining 0.3% year over year. These figures measure movement through the primary supply system rather than purchases made directly by consumers, making the distinction important when comparing inventories with broader gasoline price pressures.
Refinery Activity Remains Elevated
U.S. refineries processed approximately 16.9 million barrels of crude oil daily, down 129,000 barrels per day from the preceding week, while operating at 95.7% of capacity. Gasoline production averaged 9.4 million barrels per day, and distillate production rose to roughly 5.2 million barrels per day.
Domestic crude oil production was estimated at 14.032 million barrels per day, slightly above the previous week’s 14.013 million barrels. Crude imports fell by approximately 1.1 million barrels per day to 5.6 million barrels per day, while exports increased to about 4.5 million barrels per day.
The combination of lower imports, elevated refinery utilization and higher commercial inventories illustrates why a single weekly stock change cannot establish the direction of demand or oil prices. Market participants must also assess global production decisions, including December oil targets among major producing countries.
Crude Stocks Remain Below Their Five-Year Average
Commercial crude stocks increased from 414.4 million barrels to 417.8 million barrels, a gain of approximately 0.8% on the EIA’s unrounded calculation. Compared with the same reporting period a year earlier, commercial inventories were 6.4 million barrels lower. The latest increase therefore reduced the year-over-year shortfall without eliminating it.
A separate development occurred in the Strategic Petroleum Reserve, where inventories fell from 279.5 million barrels to 276.4 million barrels. Including government emergency reserves, total crude stocks increased by only about 0.2 million barrels, rather than the 3.4 million-barrel commercial build. The distinction matters because the government’s emergency holdings serve a different function from commercial storage, as illustrated by the separate role of emergency oil supplies.
What the Inventory Build Means for Oil Markets
Rising inventories can indicate more available supply relative to withdrawals from storage, potentially easing near-term concerns about shortages. However, the EIA’s weekly data do not independently establish whether oil prices will rise or fall, particularly when production disruptions, international trade and geopolitical developments affect the market.
Recent oil price declines and shipping supply risks illustrate competing influences beyond U.S. inventories. The gasoline build is especially important because product inventories can move differently from crude stockpiles as refinery activity, imports and consumption patterns change.
Higher gasoline inventories do not automatically translate into lower prices at the pump, where regional supply conditions, distribution costs, taxes and wholesale pricing also matter. Likewise, changes in U.S. inventories should not be treated as a complete measure of worldwide oil demand. The next scheduled EIA Weekly Petroleum Status Report is due Wednesday, November 25, 2026, at 10:30 a.m. Eastern Time, covering the week ending November 20.
It will provide the next comparison for crude, gasoline and distillate inventories, refinery utilization and petroleum products supplied. Those figures will help establish whether the latest inventory increases are sustained or represent shorter-term weekly movements.