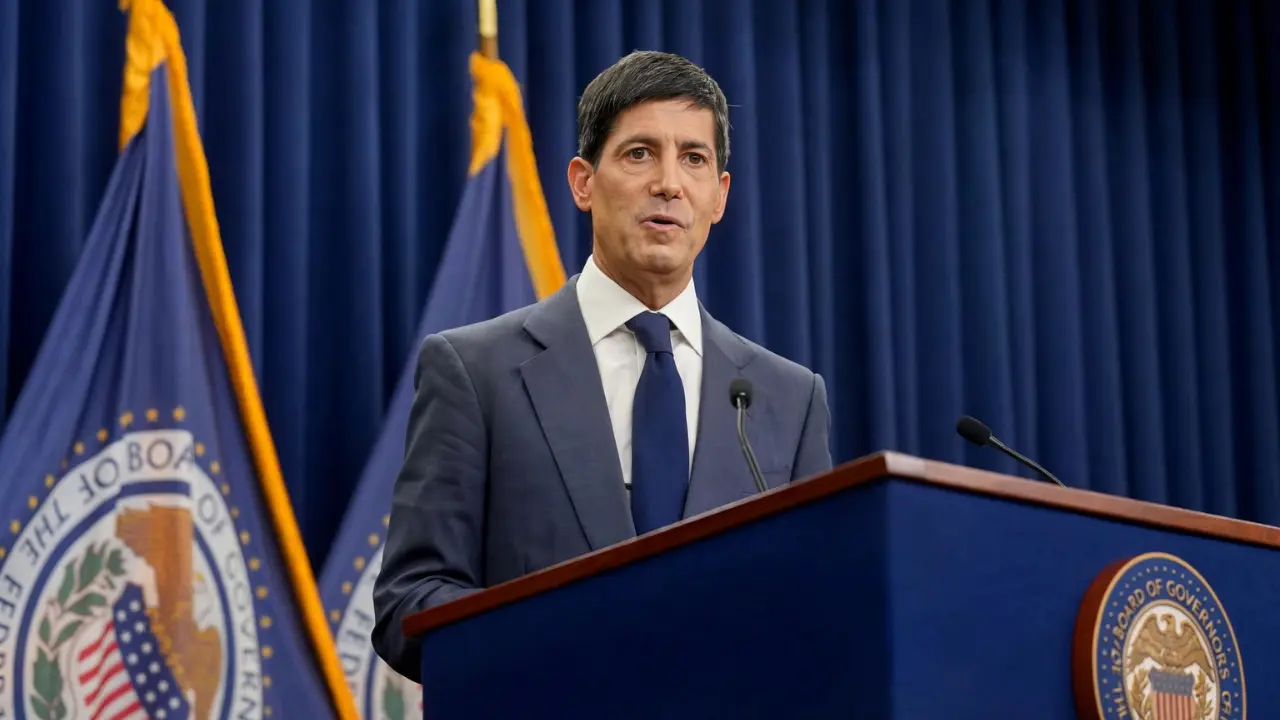
The Federal Reserve Board of Governors currently holds the Interest on Reserve Balances rate at 3.65%, keeping the effective federal funds rate target range between 3.50% and 3.75% following the May 7, 2026 FOMC decision to hold rates steady.
Fed inflation control is not a vague economic force operating somewhere far from your life. It is a specific technical mechanism that runs through a precise rate corridor, and it touches the price of every item on every shelf you shop.
The Federal Open Market Committee held rates at the May 7 meeting. That decision was deliberate. Understanding the exact tool being used tells you why prices are moving the way they are and what to expect for the rest of 2026.
The Federal Reserve does not set grocery prices. It sets the price of money. When money is expensive to borrow, the entire supply chain, producers, distributors, retailers, pays more to operate. They spend less, expand less, and eventually price less aggressively because consumer demand has been cooled. That is the transmission. It is slow, measured in quarters, and it is actively working right now.
The IORB Rate Is the Specific Lever That Moves Your Cost of Living
The Fed’s primary policy tool is the Interest on Reserve Balances rate, IORB, currently set at 3.65%. This rate is the anchor for the entire federal funds rate system. It is the rate the Federal Reserve pays commercial banks on the reserves they hold overnight at the Fed.
When the IORB rate is high, commercial banks earn more by holding reserves than by lending aggressively into the economy. That preference reduces the supply of credit available to businesses.
Businesses that cannot borrow cheaply cannot expand inventory, hire additional workers, or absorb rising input costs without passing them to consumers. The cooling effect spreads outward from the banking system into the supply chain and onto the shelf.

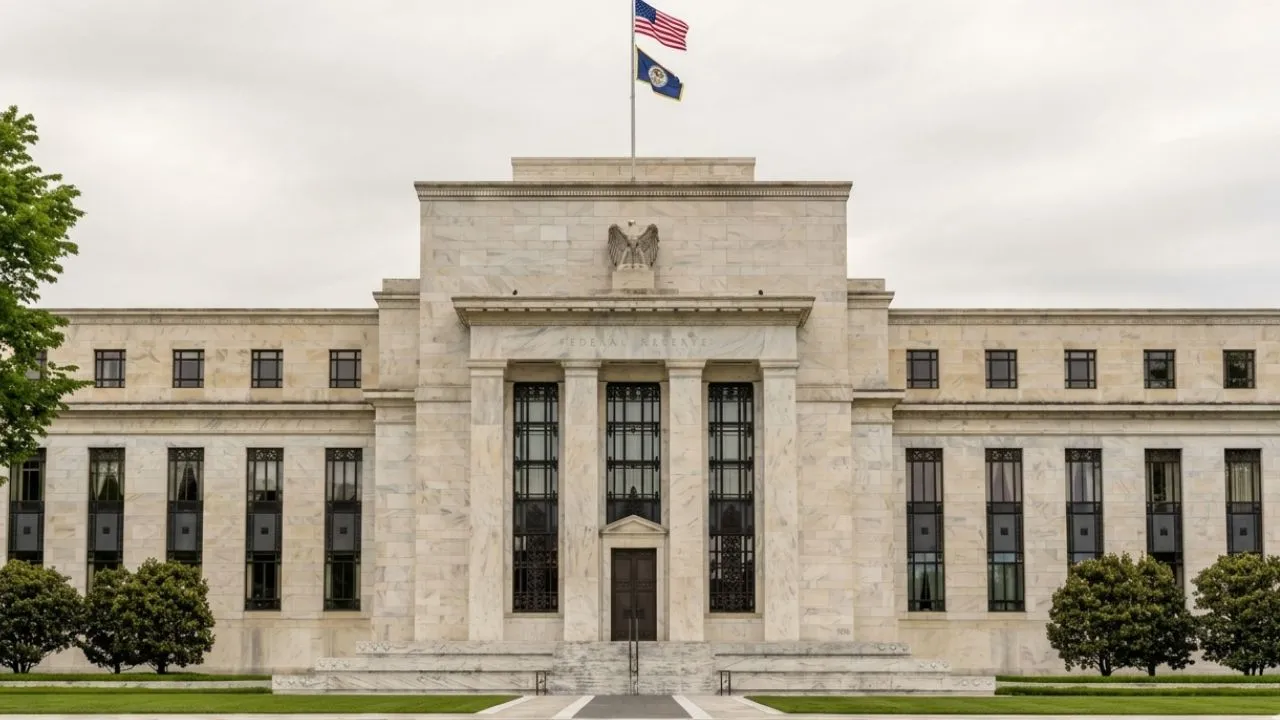
The operational architecture that enforces this rate corridor works through two overnight instruments. The Open Market Desk at the Federal Reserve Bank of New York sets a floor at 3.50% using Overnight Reverse Repurchase Agreements, capped at $160 billion per counterparty daily, and a ceiling at 3.75% through Overnight Repurchase Agreements.
No commercial bank can borrow from the system for less than the floor. No bank needs to pay more than the ceiling. This corridor keeps the effective fed funds rate pinned between those two numbers with precision. The Federal Reserve policy explained pillar article has the complete institutional framework behind this architecture.
The original observation that the government page does not surface directly: the 3.65% IORB rate you are living with right now is not punishment, it is the active coolant in a system that was running critically hot in 2022 and 2023. Every month that rate holds, another layer of price pressure bleeds out of the supply chain. The relief is real. It is just slow enough that most people cannot feel it arriving.
Higher Borrowing Costs Flow Into Prices Through a Specific Chain
The cascade from Fed rate to grocery bill runs through four distinct layers. Each layer adds cost or removes demand. Understanding the sequence makes the mechanism legible.
First, commercial banks face higher overnight funding costs. Their primary credit rate, the rate at which regional banks borrow from the Federal Reserve directly, sits at 3.75%, matching the top of the rate corridor. That rate sets the floor for every loan a commercial bank extends. Second, businesses borrowing at commercial rates pay more for credit lines, inventory financing, and capital expenditures.
A food distributor carrying $50 million in revolving credit pays materially more per month when the prime rate is elevated than when it is near zero. Third, those increased borrowing costs compress margins across the supply chain. Distributors reduce order volumes. Retailers negotiate harder on wholesale prices.
Some price pressure flows into shelf prices, but over time, compressed demand moderates the inflationary cycle. Fourth, consumer borrowing costs, credit cards, auto loans, home equity lines, also rise in this environment. When consumers pay more to service debt, they have less to spend on discretionary purchases. That reduced spending power further cools aggregate demand across the economy.
This is why the FOMC minutes May 20 2026 analysis matters for anyone watching their household budget — the language in those minutes signals how long the current corridor will hold before the FOMC considers any adjustment.
The June 16 Meeting Is the Next Inflection Point for Prices
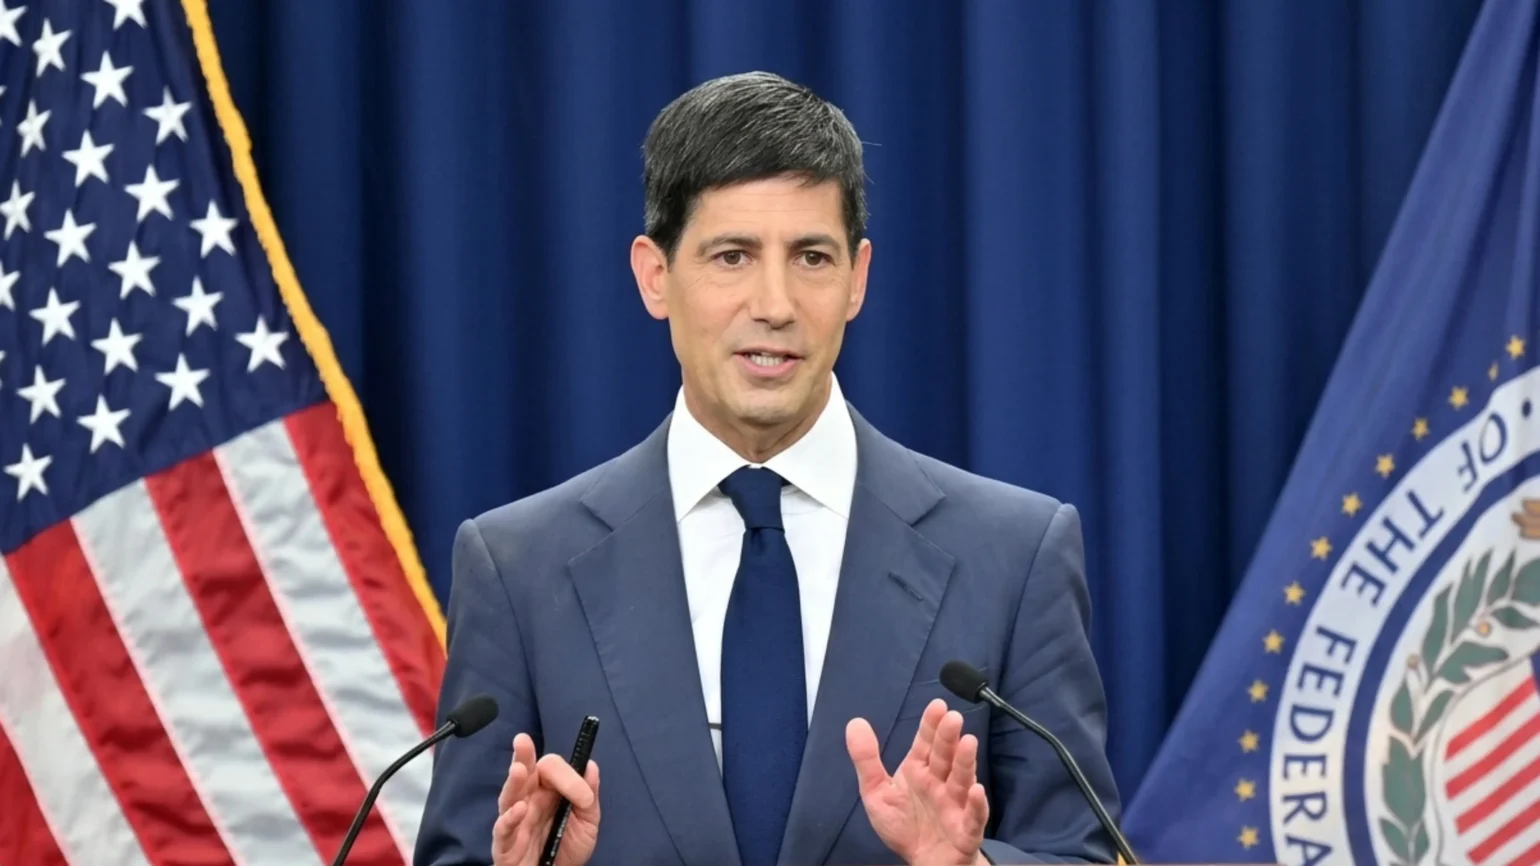
The next scheduled FOMC decision is June 16, 2026. That meeting will be Kevin Warsh’s first rate decision as confirmed Fed Chair. The June 16 FOMC Warsh rate decision preview covers what each scenario, hold, cut, or shift in guidance, means for consumer prices in the second half of 2026.
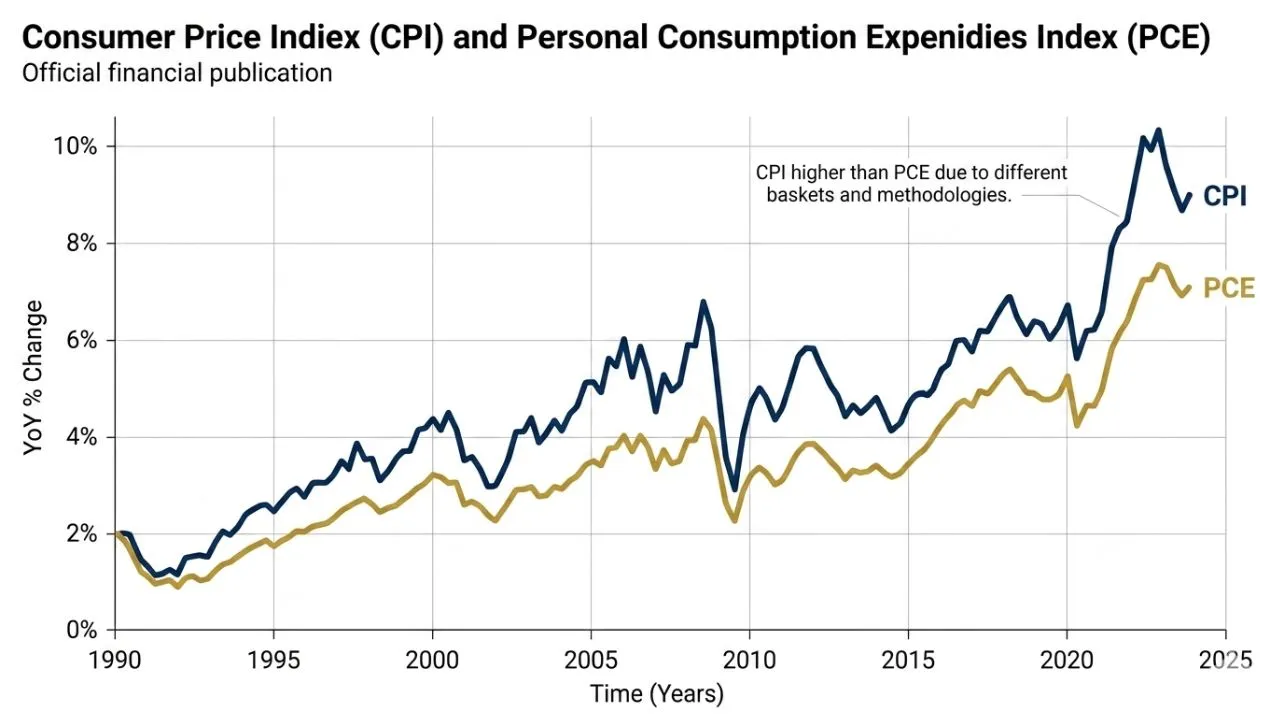
Markets are currently pricing a hold at the same 3.50%–3.75% target range for June. That pricing reflects the current inflation data trajectory. Core PCE, the Fed’s preferred inflation measure, has not yet returned to the 2% target on a sustained basis. Cutting before that confirmation risks reigniting price pressure by reducing borrowing costs before the current cooling cycle completes.
The Warsh Fed Chair rate policy changes analysis covers the new chair’s stated approach: data-dependent, willing to hold longer than markets expect, and focused on confirmed disinflation rather than projected disinflation. If that approach holds through June, the rate corridor stays in place.
Fed inflation control continues its slow, effective work. And the savings account rate after the Fed article explains exactly how that rate environment keeps your savings yield elevated while the cooling continues. For the complete picture of how the Fed rate corridor connects to direct deposit timing and federal payment settlement, see the US money movement system article.
What You Should Do Now
- Check the current IORB rate and federal funds target range at Fed policy, this is the single number that anchors every borrowing cost you face.
- If you carry variable-rate debt, credit cards, a HELOC, or an adjustable mortgage, your rate is directly indexed to the fed funds rate. A future cut reduces your cost, but only after the FOMC acts and your lender adjusts.
- Use the current Fed inflation environment to your advantage on savings. High-yield savings accounts and short-term Treasury bills both reflect the elevated rate corridor. Money sitting in a 0.5% checking account is leaving real yield on the table.
- Watch the June 16 FOMC announcement. It is the next official decision point for Fed inflation policy and will set the rate environment for at least the following six weeks.
- For official FOMC statements and implementation notes following each decision, visit FOMC calendar.