
U.S. consumer prices rose 0.4% in October 2026, slowing from September’s 0.6% increase as gasoline inflation eased sharply, although food and housing costs continued to rise. The official CPI report, released Tuesday, November 10, by the Bureau of Labor Statistics (BLS), showed that inflation excluding food and energy remained at 0.3% for the third consecutive month.
The overall monthly increase was 0.2 percentage points smaller than September’s, but prices continued rising across several major household spending categories. The report also contained an unusual gap: the government could not publish October’s annual headline or core inflation rates because the corresponding October 2025 figures were unavailable.
BLS said it had not collected survey data that month during a lapse in federal appropriations, preventing standard 12-month comparisons for most consumer price categories. Consequently, the October release provides fresh monthly inflation evidence without the full annual comparisons normally used to assess longer-term price pressures.
Inflation cooled in October, but core stayed firm
Monthly change in consumer prices, seasonally adjusted · April–October 2026
| Month | Headline CPI | Core CPI |
|---|
Monthly percentage change, seasonally adjusted. Values are percentages, not percentage points.
BLS could not report most October 2026 year-over-year inflation rates because the October 2025 data were unavailable following a lapse in federal appropriations. The chart therefore shows monthly changes only, not annual inflation.
October’s headline CPI increase of 0.4% was 0.2 percentage points below September’s 0.6%. Core CPI remained at 0.3% in both months.
Source: U.S. Bureau of Labor Statistics · Consumer Price Index, November 10, 2026 · Table A.

Housing and Food Costs Rise
Shelter prices increased 0.3% in October, easing from September’s 0.4% rise but remaining one of the largest contributors to overall inflation. BLS reported that housing accounted for more than 30% of the month’s total consumer-price increase, with owners’ equivalent rent advancing 0.3% and rent of primary residences rising 0.2%. Housing carries substantial weight in the index because shelter represents a major share of consumer expenditures, as explained in the CPI methodology guide.
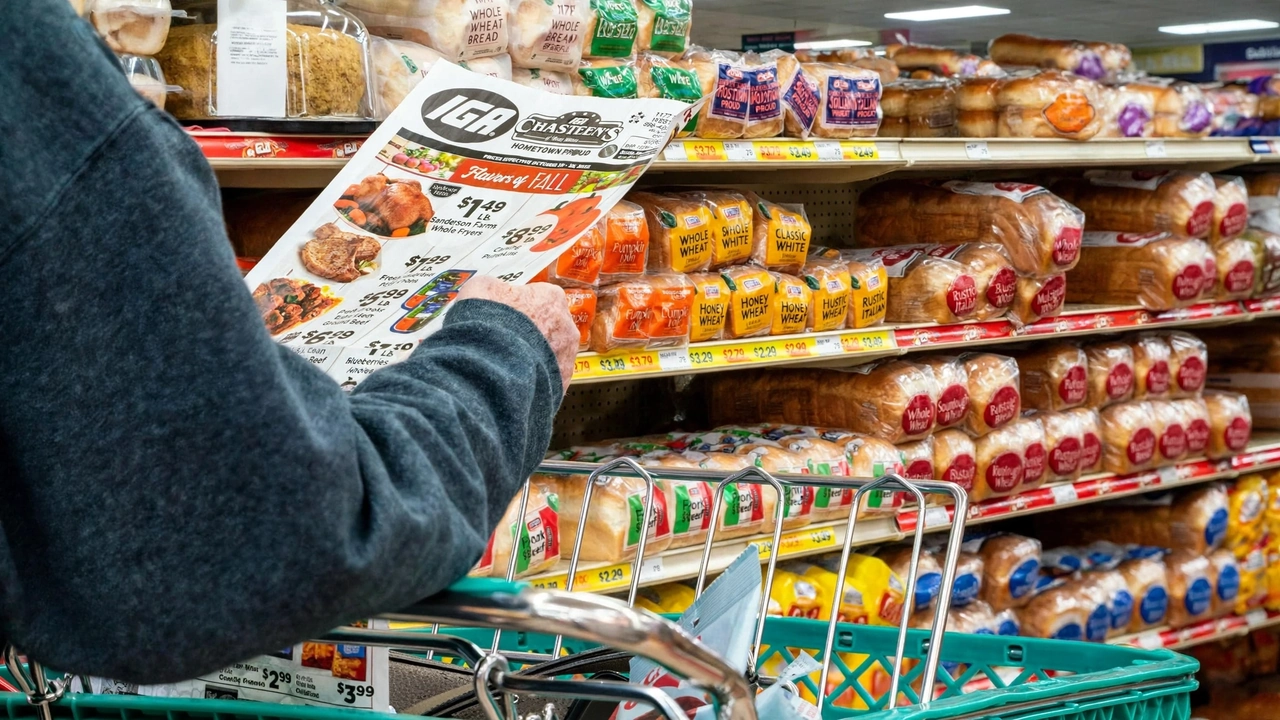
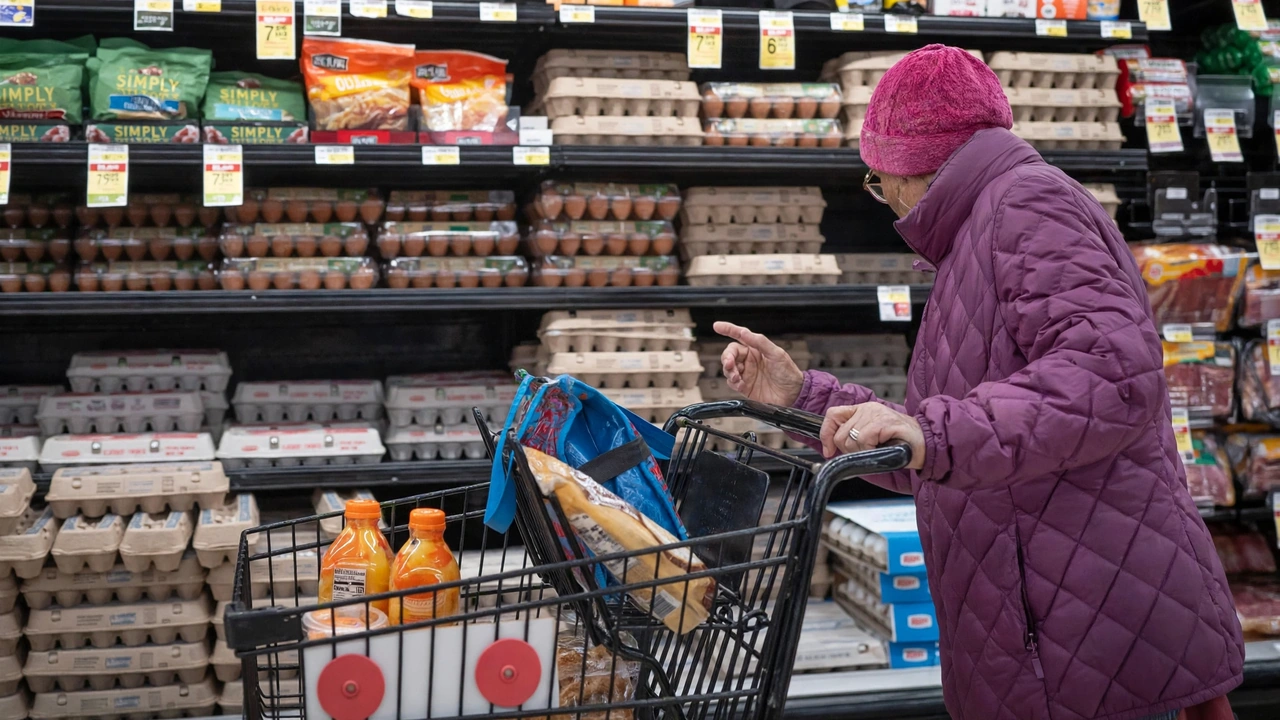
Food prices increased 0.5% after remaining unchanged in September, with grocery prices rising 0.4% and restaurant food prices advancing 0.5%. Beef prices climbed 0.9%, while fruits and vegetables and dairy products each rose 0.6%. These increases show that food contributed more to October’s inflation than in September, even as energy inflation moderated. The changing balance between food, housing and fuel costs contrasts with the July inflation report, when declining gasoline prices helped restrain the headline index.
Energy prices increased 0.7% in October, considerably slower than September’s 5.2% surge. Gasoline rose 1.0% on a seasonally adjusted basis after jumping 9.1% the previous month, while electricity increased 0.9% and utility gas service declined 0.8%.
BLS contribution tables show that gasoline added 0.042 percentage points to October’s overall inflation rate, compared with 0.337 points in September, a reduction of 0.295 percentage points based on the published figures. Earlier wholesale price pressures provide context for the preceding energy surge, although producer and consumer inflation measure different transactions.
October Inflation Numbers
The following figures come from BLS Table A, using seasonally adjusted monthly changes and unadjusted annual changes where available.
| CPI category | September monthly | October monthly | October annual |
|---|---|---|---|
| All items | +0.6% | +0.4% | Unavailable |
| Core CPI | +0.3% | +0.3% | Unavailable |
| Food | 0.0% | +0.5% | Unavailable |
| Energy | +5.2% | +0.7% | Unavailable |
| Shelter | +0.4% | +0.3% | Unavailable |
| Gasoline | +9.1% | +1.0% | +37.4% |
| Used cars and trucks | +0.7% | −1.2% | −3.3% |
Source: BLS October 2026 CPI tables. Annual figures are not seasonally adjusted. Unavailable values were not officially published.
Why Annual Inflation Rates Are Missing
The missing annual figures reflect a data-collection interruption rather than an absence of current inflation measurements. October’s usual year-over-year calculation requires comparing October 2026 prices with October 2025 prices, but the government could not publish the earlier index for most categories.
The BLS missing-data guidance explains that approximated index values are not official CPI figures and that percentage changes calculated from them should be treated as unofficial estimates. Reconstructing missing national annual rates would therefore risk presenting an estimate as a government-reported inflation figure.
The last available annual headline CPI reading was 3.7% for September, while core inflation stood at 2.6%, according to the September CPI release. Those figures describe price changes through September 2026 and cannot establish October’s missing annual rates. Some October annual comparisons remain available, including gasoline inflation of 37.4% and a 3.3% decline in used-car prices, because the necessary reference data exist for those categories. The distinction matters: October’s monthly inflation slowed, but the report does not establish whether the overall annual inflation rate accelerated or declined.
What the Report Means for Households and the Fed
The October figures present a mixed picture for household purchasing power. Slower gasoline increases reduced one source of inflation pressure, but rising grocery prices, rent and several services continued to affect consumer budgets.
September’s real earnings decline demonstrated how consumer-price increases can outpace nominal wage growth, although October CPI alone cannot determine whether workers’ inflation-adjusted earnings subsequently improved. Individual households may also experience different price changes depending on their spending patterns and location.
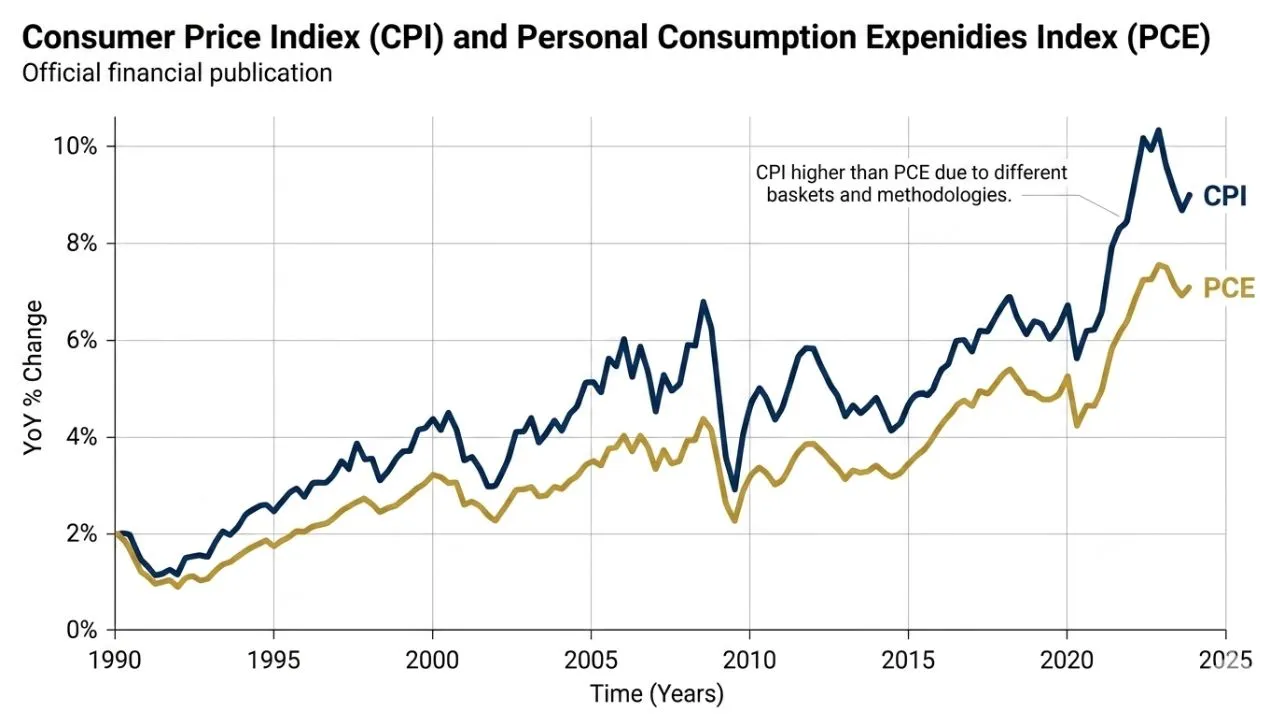
The report gives Federal Reserve policymakers evidence of slower overall monthly price growth but continued increases in underlying inflation. The central bank held interest rates at 3.75%–4.00% on October 28, before these October CPI figures were available. September’s core PCE inflation reading of 3.1% provides another measure of underlying price pressure, although PCE and CPI use different methodologies and reference periods. The Fed’s assessment requires multiple economic indicators rather than a single monthly inflation figure, and the latest report does not establish its next interest-rate decision.
Inflation’s broader economic consequences also depend on how persistent price pressures become. The Fed inflation mechanism explains why interest-rate decisions influence borrowing, spending and financial conditions over time rather than immediately changing consumer prices.
October’s 0.4% CPI increase therefore indicates that the measured price level continued rising, even though the monthly pace moderated. It does not mean that prices fell or that inflation has returned to the Federal Reserve’s longer-term objective.
What Comes Next
BLS is scheduled to release November 2026 consumer-price data on Thursday, December 10, at 8:30 a.m. Eastern Time, according to its official release calendar. That report should provide another monthly reading and the normally calculated annual comparisons where the required November 2025 reference data are available.
Separately, October’s unavailable annual headline CPI rate does not change the established Social Security COLA formula, which uses third-quarter CPI-W averages rather than October’s annual headline rate. For now, the confirmed evidence is a moderation in monthly inflation, continued increases in essential living costs and a temporary gap in several important annual comparisons.